


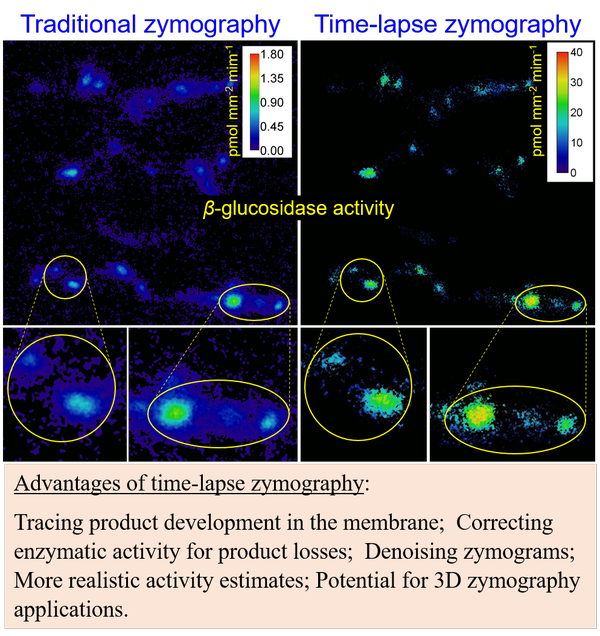
Time-Lapse-Zymography (TLZ)
Time-lapse zymography (TLZ) is an in situ quantitative method developed for evaluating and mapping the activity of hydrolytic enzymes on soil/root surfaces. It uses time-lapse photography to measure dynamics of fluorescence development in the membrane saturated in enzymes specific substrate mixed with fluorogenic reagents and incubated on soil/root surface. TLZ calculates the enzyme activity in each pixel of the membrane based on the highest rate of signal development with correction for losses due to product diffusion in the soil and membrane. The details of TLZ approach and calibration procedure are described in Guber et al. (2019, 2021). The developed code is an open source and can be downloaded with manual and examples from https://www.canr.msu.edu/profiles/andrey_guber/software.
References:
- Guber, A.K, E. Blagodatskaya, A. Juyak, B.S. Rasavi, Y. Kuzyakov, and A.N. Kravchenko. 2021. Time-lapse approach to correct deficiencies of 2D soil zymography. Soil Biology and Biochemistry 157, 108225. https://doi.org/10.1016/j.soilbio.2021.108225.
- Guber, A.K., Kravchenko, A.N., Razavi, B.S., Blagodatskaya, E., Kuzyakov, Y. 2019. Calibration of 2-D soil zymography for correct analysis of enzyme distribution. European Journal of Soil Science 70(4): 715-726. https://doi.org/10.1111/ejss.12744
- Guber A., Kravchenko A., Razavi B., Uteau D., Peth S., Blagodatskaya E., Kuzyakov Y. 2018. Quantitative soil zymography: Mechanisms, processes of substrate and enzyme diffusion in porous media. Soil Biol. Biochem., 127: 156-167. https://doi.org/10.1016/j.soilbio.2018.09.030
Dual-energy X-ray µCT
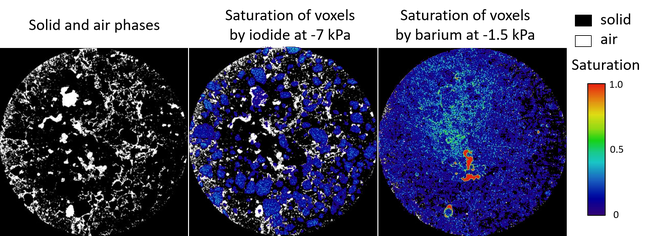
The approach uses solutions of heavy elements as a proxy for the soil water and utilizes the abrupt increase of the mass attenuation coefficient of heavy elements when crossing an X-ray absorption edge, detectable by dual-energy CT scanning. In partially saturated soils, the X-ray CT images consist of voxels with the presence of solid, liquid and gaseous phases in different ratios. These ratios are generally ignored by the traditional image segmentation methods, which separate image voxels into groups with either zero or complete saturation by either prevailing phase. The objective of this study was to develop and test a new physically based segmentation approach that accounts for partial saturation of image voxels by liquids. We combined a theoretical equation for detected photon intensity with the mass conservation equation to compute saturation of image voxels by dopant solution applied to the soil. This approach was tested on soil micro-columns with KI and BaCl2 solutions applied one after another to soil at -7 kPa and -1.5 kPa respectively. Total applied mass of each dopant and their attenuation coefficients were used to calculate I and Ba contents in soil pores. Results clearly showed different association of I and Ba with fine and coarse pores.
References:
- Guber, A., T. Kutlu, M. Rivers, A. Kravchenko. 2020. Mass-balance approach to quantify water distribution in soils based on X-ray computed tomography images. Eur J Soil Sci., https://doi.org/10.1111/ejss.13005
- Zheng, H., Kim, K., Kravchenko, A., Rivers, M., Guber, A. 2020. Testing Os staining approach for visualizing soil organic matter patterns in intact samples via X-ray dual-Energy tomography scanning. Environmental Science & Technology 2020 54 (14), 8980-8989
- Guber A. Mass-balance approach to segmentation of water distribution in soil porous media. Pedofract IX International Workshop on Advances in Soil Scaling:Theories, Techniques and Applications, El Barco de Avila (Spain), July 9-12, 2019 (Presentation available)
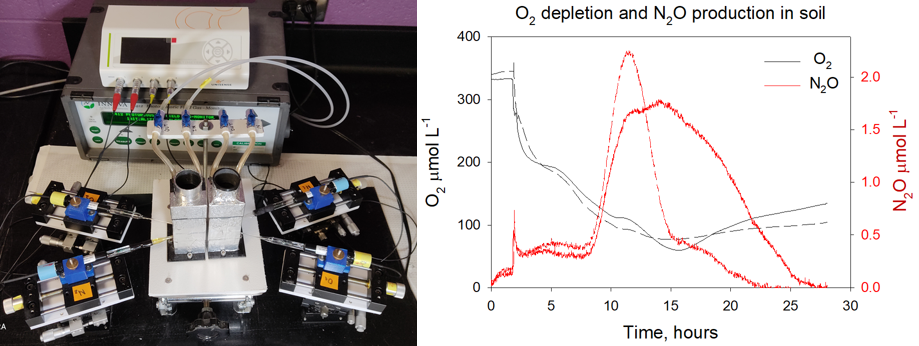
Soil microsensors setup for monitoring N2O and O2 concentrations in soil microsites
Unisense N2O and O2 microsensors with tip sizes of 100 µm, connected to the Microsensor Multimeter (Version 2.02, Unisense A/S, Aarhus N, Denmark), were used in this study to monitor dissolved and gaseous N2O and O2 concentrations on contact between soil and plant residue. The sensors were positioned using a 2D translation stage at a distance of ~ 100 µm from the plant residue in 4 x 4 x 8 cm air impermeable container. Air-dry soil aggregates (1-2 mm) were placed to the container and brough to 30% gravimetric water content. In addition to the microsensors, CO2 and N2O emissions were measured from the soil surface using a circulation system connected to a Photoacoustic Field Gas-Monitor – INNOVA 1412 (Innova AirTech Instruments, Denmark). The microsensors detected a gradual depletion of O2 and N2O spikes in the soil in vicinity to the leaf surface.
Reference:
Kim, K., T. Kutlu, A.N. Kravchenko, A.K. Guber. 2021. Dynamics of N2O in vicinity of plant residues: a microsensor approach. Plant and Soil https://doi.org/10.1007/s11104-021-04871-7.
Planar Oxygen and pH optodes
Spatial patterns in O2 distribution within the soil microcosms and pH distribution within lupine rhizosphere were studied using planar optical sensors (optodes) manufactured by PreSens (Precision Sensing GmbH). The O2 sensitive foil (SF-PSt3- NAU-YOP) was glued to the inner side of the container with the microcosm sample and the leaves placed at the bottom of the microcosms. The sensor signal was read every 20 min for 4 days from the start of the incubation. Relative deviation of O2 levels from the pre-incubation average was used to assess O2 changes in the microcosms without (control) and with corn and soy leaves. The SF-HP5R foil and a LED light with excitation wavelength of 470 nm were used for pH measurements. A clear gradient of pH was observed in the images between the lupine rhizosphere and bulk soil. 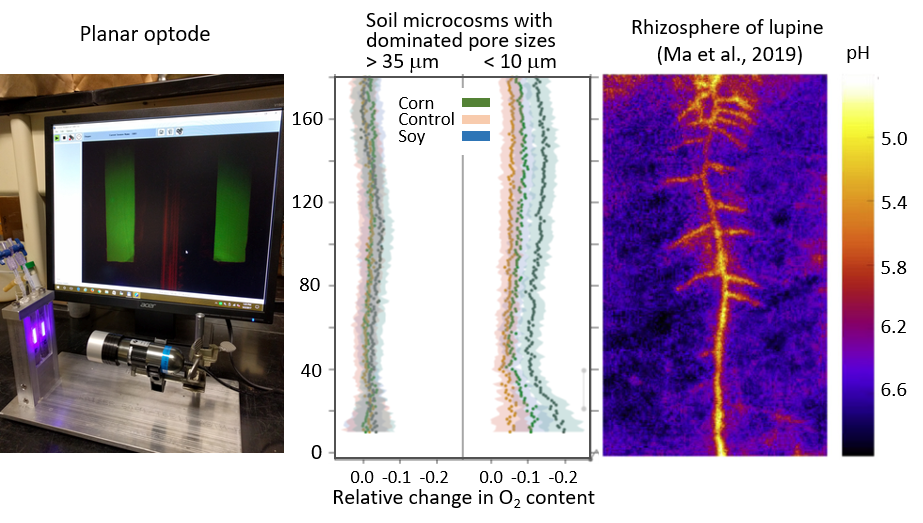
References
- Kravchenko A.N., Toosi E.R., Guber A.K., Ostrom N.E., Yu J., Azeem K., Rivers M. L., Robertson G.P. 2017. Hotspots of soil N2O emission enhanced through water absorption by plant residue. Nature Geoscience, DOI: 10.1038/NGEO2963
- Ma, X., Mason-Jones, K., Liu, Y., Guber, A.K., Dippold, M.A., Razavi, B.S. 2019. Coupling zymography with pH mapping reveals a shift in lupine phosphorus acquisition strategy driven by cluster root. Soil Biol. Biochem., 135, pp. 420-428.
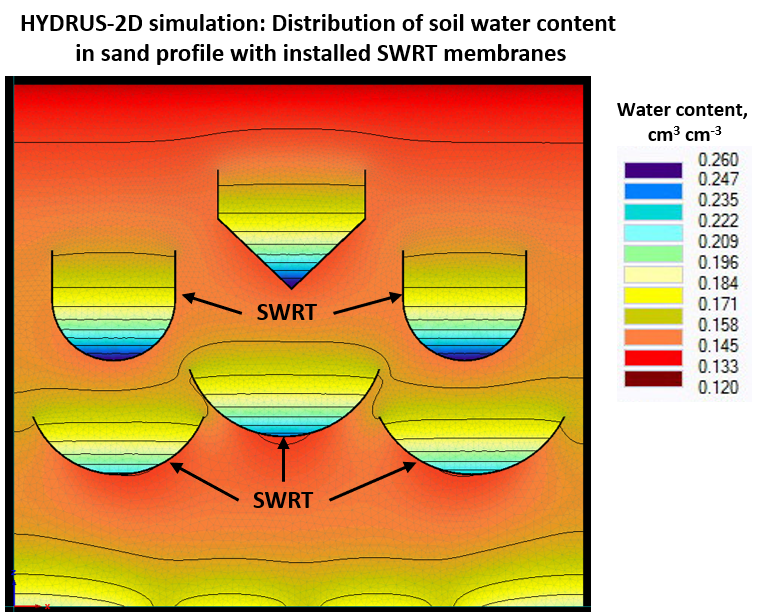
Subsurface Water Retention Technology (SWRT)
SWRT is a new, long-term approach developed to improve water storage capacities of sandy soils for sustainable crop production. It consists of subsurface polyethylene membranes installed within the soil profile that prevent the loss of irrigation water via deep percolation. A greenhouse experiment was conducted to identify membrane shape and placement to maximize the reduction in irrigation losses. Distribution of water was measured in a surface-irrigated sand lysimeter with six membranes of different geometry installed at four depths. The HYDRUS-2D model calibrated on the results of soil water content monitoring and was used to estimate water losses from four soils modified with SWRT membranes. Membranes with 2:1, 3:1, and 5:1 aspect ratio installed at the 20- and 40-cm depths in sand, sandy loam, loamy sand, and sandy loam soils were used in the simulations. Different vertical and horizontal alignments were also tested for the 2:1 membrane aspect ratio. The HYDRUS-2D model adequately described the dynamics of water content measured in the lysimeter experiment. The simulation results showed that the highest reductions in water loss for most studied soil textures were achieved with a 2:1 aspect ratio membrane installed at the 20-cm depth. The SWRT was sensitive to excessive irrigation, and its performance declined rapidly in response to overirrigation. DSSAT-CSM model coupled with HYDRUS-2D software allowed optimizing irrigation for crop production (Roy et al., 2019 a,b).
References
- Guber A.K., A.J.M. Smucker, S. Berhanu J. M. L. Miller. 2015. Subsurface water retention technology improves root zone water storage for corn production on coarse textured soils. Vadose Zone Journal, 14: 2-13. doi:10.2136/vzj2014.11.0166.
- Roy, P.C., Guber, A., Abouali, Deb, K., Smucker, A.J.M. 2019a. Simulation optimization of water usage and crop yield using precision irrigation. Lecture Notes in Computer Science (including subseries Lecture Notes in Artificial Intelligence and Lecture Notes in Bioinformatics). 11411 LNCS: 695-706.
- Roy, P.C., Guber, A., Abouali, Deb, K., Smucker, A.J.M. 2019b. Crop yield simulation optimization using precision irrigation and subsurface water retention technology Environmental Modelling and Software 119: 433-444.
- Guber, A. A.J.M. Smucker 2013. Improving Soil Water Holding Capacity by Subsurface Water Retaining Membranes. Abstract, Soil Science Society Meeting, Tampa, Florida, 3-6 Nov. (presentation available).
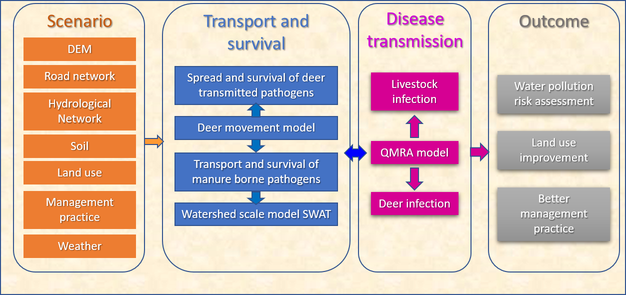
Modeling pathogen transmission between wildlife and livestock
A new add-on module SIR (Susceptible - Infected – Recovered) developed for the watershed scale model SWAT can predict transmission of the manure-borne pathogens between co-grazing livestock and deer. The new model allows analyzing annual dynamics of infected cattle and deer, pathogen shedding and loads on agricultural and forested lands, release of pathogens from fecal deposits to foliage and soil, pathogen overland transport and surface water pollution. The software provides insights into relationships between farm manure operations, pathogen transmission to deer, and pathogen appearance in surface water. This information can be helpful in identifying the potential sources of pathogenic microorganisms and for development of better management practices to reduce pathogen loads on fragmented agricultural and forest landscapes.
New processes modeled by the SWAT-SIR model include: (a) seasonal changes in deer population and habitat; (b) resource selection and seasonal changes in foliage consumption by deer; (c) ingestion of pathogens with water, foliage and via grooming soiled hide by deer and grazing cattle; (d) infection and recovery of deer and co-grazing cattle; (e) pathogen shedding by infected animals; (f) survival of pathogens in manure; (g) kinetic release of pathogens from applied manure and fecal material. The model output is linked with ARC-GIS to allow spatial and temporal analysis of pathogen distribution across the watershed for specific land use, weather, and management scenarios.
References
- Guber, A.K., D.M. Williams, A.C. Dechen Quinn, S.B. Tamrakar, W.F. Porter, J.B. Rose. 2016. Model of pathogen transmission between livestock and white-tailed deer in fragmented agricultural and forest landscapes. Environmental Modelling & Software Volume 80, June 2016, Pages 185–200. http://dx.doi.org/10.1016/j.envsoft.2016.02.024
- Guber A.K., D.M. Williams, A.C. Dechen Quinn, S.B. Tamrakar, J.B. Rose, W.F. Porter. 2014. SWAT-SIR Model for Predicting Fate and Transport of Manure-borne Pathogens in Fragmented Agriculture-Forest Ecosystems. In Ames, D.P., Quinn, N.W.T., Rizzoli, A.E. (Eds.), 2014. Proceedings of the 7th International Congress on Environmental Modelling and Software, June 15-19, San Diego, California, USA. ISBN: 978-88-9035-744-2 (presentation and publication available).
- Guber A., J.B. Rose, W.F. Porter, D.M. Williams, S.B. Tamrakar and A.C. Dechen Quinn. 2013. Modeling Pathogen Transport in Fragmented Agriculture-Forest Ecosystems. Abstract, Soil Science Society Meeting, Tampa, Florida, 3-6 Nov.
- Rose J., Guber A., Porter W., Williams D., Tamrakar S., Dechen Quinn, A. 2012. Multimodeling Framework for Predicting Water Quality in Fragmented Agriculture-Forest Ecosystems. Abstract to be presented at 2012 Fall Meeting, AGU, San Francisco, Calif., 3-12 Dec.
 Print
Print Email
Email