Bulletin E-3507
Bulletin E-3507 Introduction to Fertilizer Planning for Vegetables
DOWNLOAD
June 9, 2025 - Jonathan LaPorte
 Print
Print Email
EmailAs a young or beginning farmer, you may be raising crops to reduce feed costs or to sell on the market. One of the important decisions in crop production is deciding how much fertilizer you should apply. Fertilizer application focuses on meeting the nutrient needs of the crop you’ll grow. Too much fertilizer and potential profits are reduced. Too little fertilizer and there is not enough production. To meet the nutrient needs and produce a profitable crop, you’ll need to create a fertilizer plan.
This publication explores the process of creating a fertilizer plan. This includes spending some time understanding the soil and the available nutrients within it. You’ll also learn about the available forms of fertilizer and the methods of applying them to the soil. Using the information collected from both the soil and the available fertilizer options, you’ll begin to create a fertilizer plan for the farm. Creating a fertilizer plan also includes understanding what the costs are and their impacts on farm revenue.
Many factors go into fertilizer planning. Understanding the soil is the first consideration since this is where fertilizer will be applied. The properties and characteristics of the soil in your field can greatly affect the types of fertilizers and application methods you will want to use. Soil tests and their results are important to knowing what nutrients are already present and if they are available to the intended crop. Soil characteristics and the availability of nutrients is crucial information as you start to think about the amount of nutrients needed overall.
The amount of nutrients needed is influenced by what the yield goals are and whether the soil needs to be built up or if nutrient needs should only consider crop removal rates. Finally, how these nutrients will be applied completes the decision factors needed for a successful and profitable crop. You can use many types of fertilizer. When you apply them is critical to a successful plan.
Note: This publication considers general concepts for fertilization in open-field vegetables, but not the use of drip fertigation in intensive vegetables (on raised bed, etc.). For information on fertilizer use in drip fertigation systems, please review the additional resources section on the last page.

|
Figure 1. Ideal soil has 50% pore space and 50% water and air. |
Understanding the Soil
You will get your plan started by understanding the soil that you’re working with in the fields.
Soil is made up of soil particles, air, and water. Ideally, soil should be filled with 25% water and 25% air and the other 50% with soil particles (see Figure 1). This maximizes the availability of nutrients to roots and keeps a healthy environment for soil microbes that help with nutrient uptake.
The type of particles often varies by the amount of sand, silt, or clay (see Figure 2). Depending on the amount of each type of particles you have in your soil, the ability to interact with nutrients will be different from field to field. Knowing the soil type helps you understand what fertilizer options and strategies are best. For more information on the soil types in your field, visit the United States Department of Agriculture Web Soil Survey (https://websoilsurvey.sc.egov.usda.gov/App/HomePage.htm).

|
Figure 2. Soil types contain various amounts of sand, silt, or clay. Source: Soil Science Division Staff. (2017). Soil survey manual. C. Ditzler, K. Scheffe, and H.C. Monger (eds.). USDA Handbook 18. Government Printing Office, Washington, D.C. (page 125) https://www.nrcs.usda.gov/wps/portal/nrcs/detail/soils/ref/?cid=nrcs142p2_054261 |
|
Figure 3. pH at 6.5 is considered optimal for most crops, because it allows access to nutrients needed in larger quantities. Source: USDA Resources Conservation Services. National Soil Survey Manual. |
The chemical make-up of the soil also influences nutrient availability. Adequate amounts of water, air, and soil particles are necessary, but chemically balanced soil is as well. If soils are balanced, they have the optimal pH, and plant roots can freely take up nutrients. If soil pH is too high or too low, nutrients may be present, but the plants are unable to access them.
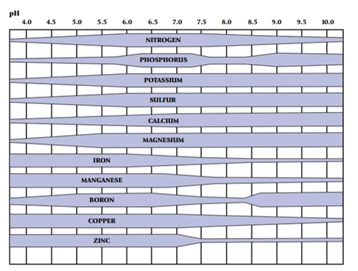
Use the pH scale to guide you toward that chemical balance and achieve ideal growing conditions for the intended crop. The optimum pH level for most vegetables in Michigan is 6.5 with some crops requiring 6.0 to 6.8. Identifying the optimum pH for the crop being grown is important, because it allows them access to nutrients needed in larger quantities (see Figure 3). Nutrients needed in large amounts can include nitrogen, phosphorus, potassium, sulfur, calcium, and magnesium.
To identify soil characteristics and the available nutrients present, routine soil testing is necessary. Ideally, you should test soil every three years or when a practice or management change is implemented. Soil tests tell where the pH levels are and help track them over time. If pH levels are low, a soil amendment called lime may be needed to bring pH back up to optimum levels. The Michigan State University (MSU) Extension bulletin Lime for Michigan Soils (E-471) (https://www.canr.msu.edu/uploads/resources/pdfs/lime-for-mi-soils-e-471.pdf) provides guidance on using lime to correct pH levels.
Soil tests also help to track the amount of nutrients available and if those levels are increasing or decreasing over time. If nutrient levels are low, MSU Extension recommends using build-up rates of fertilizer to bring nutrient levels up to a more sufficient level. Once at a sufficient level, there is no agronomic reason to apply fertilizer. The goal is to maintain soil nutrients at optimal levels, where a yield response to fertilizer is not expected. At optimal levels, the only fertilizer applied should be to recover what nutrients the crop will remove at harvest.
To understand the amount of nutrients to apply to the soil, consider the farm’s yield goals. Yield goals have several determining factors. They include the soil type, the cation exchange capacity (CEC) level, the availability of water throughout the growing season, and the experience of the producer growing the crop.
|
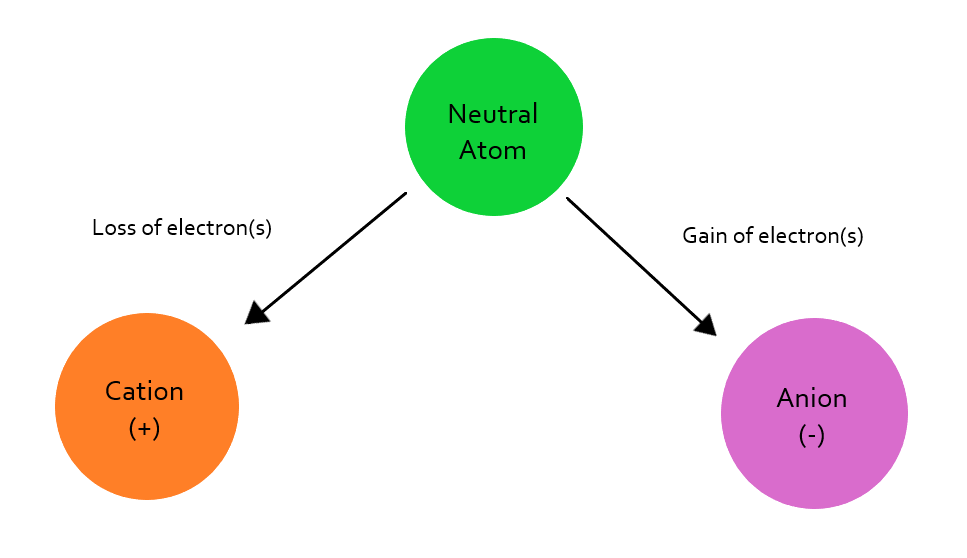
Figure 4. All nutrients are made up of positively or negatively charged ions. |
Cation Exchange Capacity
While all of these factors are important, the CEC is perhaps the most important in determining a yield goal. CEC is a measure of the soil’s ability to hold positively charged ions. All nutrients are made up of ions. The ions with a positive charge are called cations and the ions with negative charges are called anions (see Figure 4). Soils can readily hold cations, but they hold few anions. The higher the CEC level, the more positively charged nutrients, or cations, the soil can hold.

|
Table 1. Nutrients are either positively charged cations or negatively charged anions. |
The soil’s structure and stability when growing a crop influences the CEC. The CEC influences nutrient availability, pH levels, and even how the soil will react to fertilizers. For example, an old standby used by producers is to take the CEC level and multiply by two, giving an indication of the nitrogen holding capacity of the soil.
Consider the types of nitrogen fertilizers that can be applied to the soil (see Table 1). Ammonium sulfate and anhydrous ammonia contain ammonium ions, which are positively charged cations. The soil can hold on to these nutrients for a longer period of time without the immediate concern of nutrient leaching. Nutrient leach is the downward movement of dissolved nutrients in the soil with gradually moving water.
On the other hand, nitrogen fertilizers such as urea ammonium nitrate (UAN) are mostly made up of nitrate ions, which are negatively charged anions. The soil does not hold on to anions for a significant amount of time, leading to more concerns of nutrient leaching with these types of products.
The CEC is also an indicator of the soils ability to hold water. Water, or H20, is made up of ions, too. Soils with higher amounts of silt, clay, and organic matter have higher CEC levels than sandy soils, so they can hold on to larger amounts of water and nutrients. The higher the CEC levels, the greater amount of water-holding capacity the soil has. Typically, CEC levels of 11 to 50 retain more water than levels below 11.
Rate of Nutrients to Apply
Equipped with the soil’s ability to hold on to water and nutrients, as well as soil test results for the farm, the next consideration is the rate of nutrients to apply. There are several methods of determining nutrient amounts to apply, but using a build-up and maintenance approach is recommended.
|
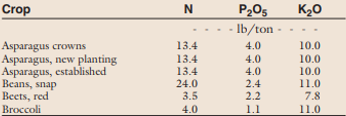
Table 2. Research-based Nitrogen rates for several Michigan vegetable crops. Source: Adapted from “Table 3. Nutrient Removal in Harvested Portions of Several Michigan Vegetable Crops” in Warncke, D., Dahl, J., & Zandstra, B. (2004). Nutrient Recommendations for Vegetable Crops in Michigan (E-2934). Michigan State University, p. 9. (https://www.canr.msu.edu/fertrec/uploads/E-2934-MSU-Nutrient-recomdns-veg-crops.pdf) |
A build-up and maintenance approach involves applying enough fertilizer to keep the soil at healthy levels. The application of nutrients is based on soil test recommendations that will meet the farm’s yield goals. Build-up and maintenance is a method used for phosphorus and potassium applications. For nitrogen applications, research-based rates can be found in MSU Extension bulletin Nutrient Recommendations for Vegetable Crops in Michigan (E-2934) (https://www.canr.msu.edu/fertrec/uploads/E-2934-MSU-Nutrient-recomdns-veg-crops.pdf) as illustrated in Table 2.
Since production numbers won’t be known until harvest, you’ll need to finalize the farm’s yield goal to fully use soil test information as part of your fertilizer planning. Look at an example using a field of sweet corn.
To find the amount of nutrients needed, you must calculate the yield goal for the sweet corn crop. This means locating information on the soil type, the CEC level, the availability of water throughout the growing season, and the experience of the producer growing the crop.
|
Example Sweet Corn Farm |
|
|
Soil Type: |
Sandy Loam |
|
Cation Exchange Capacity (CEC) Level: |
5 |
|
Availability to Water: |
No irrigation – dryland field |
|
Grower Experience: |
10 years of raising sweet corn |
|
Expected Yield Goal: 8 tons per acre |
|
Table 3. Example Sweet Corn Farm.
Information on the example farm in Table 3 reveals that the field has a soil type of sandy loam and CEC levels from the soil test results are below 11. These results indicate there is not a great deal of water or nutrient-holding capacity in the soil. The field is also considered “dryland” as it does not have an irrigation system, which means its availability to water is dependent solely on rainfall. Lastly, let’s say that you have roughly 10 years of experience raising sweet corn and understand how it reacts in this type of environment. You calculate an expected yield goal of eight tons per acre for this example farm.
The next step is to conduct a soil test to find out your actual needs. Following the soil sampling guide form Michigan State University (MSU), A Field Guide to Soil Sampling (www.canr.msu.edu/resources/a-field-guide-to-soil-sampling), you take a sample of your field. The sample is submitted and MSU provides a recommendation based on your yield goal and soil test results. The results of your soil test recommend 120 lbs. of nitrogen, 55 lbs. of phosphorus, and 50 lbs. of potassium will be needed at current nutrient levels.
The fertilizer needs of this example sweet corn crop have been identified. The next step is to consider how those nutrient needs can be met. Continue exploring the fertilizer planning process by looking at fertilizer options.
Fertilizer Options
Many sources of fertilizer are available to producers. These sources often include organic and inorganic forms. Two main sources are manure and commercial products.
Manure Sources
Manure provides many of the nutrients needed to raise crops, making it an ideal source of fertilizer. The amount of nutrients within manure can vary by the livestock source, whether that source is from a dairy, beef, poultry, or even a swine operation. It can also vary by the nutrient content of the feed being fed to those sources. Dairy cows being fed certain feed mixes or rations can have significantly different amounts of nutrients available in their manure compared with dairy cows receiving other feed mixes or rations. If you purchase manure, make sure that you are given its nutrient content.
Test manure samples to determine accurate nutrient levels before applying manure to any fields. The remaining nutrients not provided in the manure can then be met using commercial products. Only use licensed labs that test for moisture, total nitrogen (N), ammonium N, organic N, phosphorus as P2O5 and potassium as K2O.
Commercial products often have a greater availability than that of manure. There is also more uniformity in application as nutrient levels tend to remain relatively the same from one load to the next. However, commercial products are typically more expensive than manure alternatives. These considerations keep both options viable to producers depending on their situation.
Manure is highly regulated within Michigan because of the concern of overapplication and the desire to maintain safe levels of phosphorus in the soil.

|
Figure 5. Soil test levels help determine how much manure can be applied to a field. |
To apply manure, you should follow the Generally Accepted Agricultural and Management Practices guidelines (GAAMPs) from the Michigan Right to Farm program (https://www.michigan.gov/mdard/0,4610,7-125-1599_1605---,00.html). These guidelines use the field’s soil tests to determine how much manure can be applied to a field (see Figure 5).
If soil phosphorus levels are higher than 150 ppm (equivalent to 300 lbs.), you will need to draw down the nutrient levels before you apply more manure. If the test levels are below 75 ppm, you can apply manure to supply all crop nutrient needs.
If test levels show phosphorus is between 75 and 150 ppm, you can apply crop removal or maintenance amounts each year. However, while applications each year are an option, doing so is often impractical. One load of manure typically carries more than one year’s worth of crop removal. In an effort to recognize this, up to four years’ worth of crop removal can be applied at one time. Afterward, you’ll have to wait four years before re-applying.
If using manure as your fertilizer source, make sure that it does not interfere with your food safely plan for fresh market produce. Check with food safety guidelines on pre-harvest intervals prior to application. In some cases, it may be wiser to consider a commercial fertilizer if pre-harvest intervals are small.
Commercial Products
Commercial products are regulated by state and federal laws as well. These products are required to display their nutrient content within their label.
At least three numbers are associated with the nutrient content in a label. The first number is the amount of nitrogen in the product; the second number, the phosphorus amount; and the third number, the potassium amount. This is often referred to as the NPK ratio and indicates the percentage of each nutrient regardless of whether the product is in a dry or liquid formulation. Nutrient ratios that have more than the NPK will always include the number and the letter corresponding to the nutrient such as the 17% sulfur included with potassium thiosulfate.
|
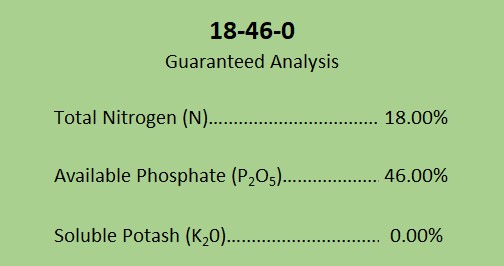
Figure 6. Label of diammonium phosphate. |
With dry products, determining the amount of nutrients being purchased is relatively easy to calculate. Diammonium phosphate (DAP) contains 18% nitrogen and 46% phosphorus in the form of P2O5 (see Figure 6).
Using 100 lbs. of this product contains 46 lbs. of P2O5. In that same 100 lbs., you will also receive 18 lbs. of nitrogen.
How does this convert to tons if you are purchasing a ton of this product? A ton equals 2,000 lbs., therefore 46% of one ton of DAP contains 920 lbs. of P2O5. A ton also contains 18% or 360 lbs. of nitrogen.
For a liquid product, the focus is on gallons per acre being applied. This requires more math than using dry products because tons must be converted to gallons. To convert tons into gallons, the density of the product is a factor. Density refers to how much a gallon of the product weighs.

|
Figure 7. Label of ammonium polyphosphate. |
In the case of ammonium polyphosphate, or 10-34-0, each gallon weighs 11.7 lbs. The label indicates that for every pound there is 34% phosphorus in the form of P2O5. Multiplying 11.7 by 34% reveals that in every gallon of 10-34-0, there are 3.98 lbs. of P2O5.
Ammonium polyphosphate also contains 10% nitrogen. Using the same density weight of 11.7 lbs. and multiplying it by 10%, each gallon of the product contains 1.17 lbs. of nitrogen (see Figure 7).
This product may also be purchased in tons. One ton contains 171 gallons (2000 lbs. ÷ 11.7 lbs. = 171 gallons) of product. If one gallon has 3.98 lbs. of P2O5, then 171 gallons will have 680 lbs. of P2O5 (3.98 lbs. x 171 gallons). One gallon also has 1.17 lbs. of nitrogen or 200 lbs. in one ton.
Fertilizer Application Timing

|
Figure 8. Planters apply fertilizer close to the seed to encourage uniform growth. |
The next consideration is how the fertilizer products will be applied. With most crops, there are three main application periods: pre-plant, at the time of planting, or post-emergence.
The pre-planting period occurs before the seeds are planted in the soil. Typically, fertilizer is applied through broadcast spreading, incorporation into the soil, or both. Incorporation can be by tillage following broadcast or through injection.
The second method occurs at the time of planting, typically through the planter and often referred to as starter. The use of the term starter comes from the planter placing the fertilizer close to the seed. The placement of the fertilizer encourages more rapid and uniform growth in the field as the plant “starts” out (see Figure 8).
The last method is post-emergence, which occurs after the plants have emerged from the soil. This is accomplished by either broadcasting, spraying with pesticides, “Y” drops, or incorporation. These are often referred to as side-dress applications (see Figure 9).

|
Figure 9. Incorporating fertilizer after plants emerge is often called side-dress. "Applying Anhydrous Ammonia" by Macomb Paynes is licensed under CC BY-NC-SA 2.0 . |
As you consider application strategies, examine their impact on growing plants. If all fertilizer is applied at pre-plant, it may be too early for the crop to fully utilize. There are also risks that fertilizer may leach or not be as readily available later in the season. Alternatively, if all fertilizer is applied at post-emergence, the crop may not grow uniformly during the season prior to the application. The crop could also suffer nutrient deficiencies before the fertilizer is applied. Therefore, the timing of application can be as impactful as the types of fertilizer being applied.
Consider an example where 250 lbs. of nitrogen are applied at planting. Nitrogen leaching causes 30% or 75 lbs. of lost nutrients over the course of the season. If these nutrients are valued at $0.55 per pound and multiplied by 75 lbs., then the loss to leaching is $42 per acre. In addition, a significant amount of nutrients is not available when the plant needs them later in the season.
Risks of nutrient availability and deficiencies are minimized by splitting the applications over multiple periods. This is especially important for sandy soils with lower CEC levels due to their lower nutrient-holding capacity. Some producers also make use of nitrogen stabilizers to extend the availability of nutrients in season. For more information on stabilizer products, review University of Nebraska–Lincoln’s Crop Watch article “Nitrogen Fertilizer Stabilizers in Corn” (https://cropwatch.unl.edu/2018/nitrogen-fertilizer-stabilizers-corn).
Type of Fertilizer Products to Apply
Deciding which type of products to use depends on the type of equipment, amount of available labor hours, and cost of nutrient products per application. For example, if your farm’s equipment is set up for dry fertilizer products, the use of any liquid products will require purchasing new equipment or hiring a custom applicator. Single-operator farms with no employees have a limited amount of time that they can spend on applications. This often requires custom hiring to assist in fertilizer applications and can present opportunities for both liquid and dry products to be used. These opportunities also extend to the spreading of manure, especially if the farm does not own any livestock.
Creating a Fertilizer Plan
Everything to this point has been about understanding the components needed to create a fertilizer plan. Now it’s time to take that information and begin building the plan for your farm.
To help you think about this process, continue with the example sweet corn farm with a yield goal of 8 tons per acre. Your soil test recommendations indicate you’ll need 120 lbs. of nitrogen, 55 lbs. of phosphorus, and 50 lbs. of potassium. These nutrient amounts maintain the soil at current levels and meet the yield goal.
Fertilizer Plan (Dry Products Only)
To apply nutrient amounts using only dry products, first calculate phosphorus needs. Some fertilizer products containing phosphorus may also contain other nutrients, such as nitrogen. For example, diammonium phosphate (DAP) contains both phosphorus and nitrogen. When calculating how much of this product to use for phosphorus, a portion of nitrogen needs may be covered as well.
As you recall, 100 lbs. of diammonium phosphate contains 46% or 46 lbs. of P2O5 and 55 lbs. of P2O5 are needed. If you divide 55 lbs. by 46% the results indicate that 48 lbs. of diammonium phosphate can be applied to meet the phosphorus needs (Equation 1).
|
P205 needs |
P205 needs |
Calculation |
DAP to Apply |
|
55 lbs. |
46% |
55/0.46 |
120 lbs. |
Equation 1. Amount of diammonium phosphate to apply.
Now, consider the nitrogen being applied with the same product. There are 120 lbs. being applied so how should nitrogen be considered? First, because of the concern of leaching over time, it is important to determine if the timing of the application will make the nitrogen available to the crop. If nitrogen will not be available, then it should not be counted toward meeting the yield goal. This is true of any nutrient that has a concern of leaching.
In this example, consider that all nutrients can be utilized and counted toward the yield goal. Since DAP contains 18% nitrogen in every pound, the farm is receiving 22 lbs. of nitrogen in the 120 lbs. being applied (Equation 2).
|
18-46-0 Applied |
% Nitrogen |
Calculation |
Nitrogen Applied |
|
120 lbs. |
18% |
120 x 0.18 |
22 lbs. |
Equation 2. Amount of nitrogen in diammonium phosphate being applied.
Those 22 lbs. can be subtracted from the overall nitrogen needs of 120 lbs. to leave 100 lbs. remaining. To apply the remaining 100 lbs. of nitrogen, the farm will be using urea. Urea is 46% nitrogen, which means every 100 lbs. of the product contains 46 lbs. of nitrogen. To find the urea amount to apply, divide 100 lbs. by 46%. This calculation reveals that lbs. of urea are needed to reach the 8 tons per acre yield goal (Equation 3).
|
N needs |
% N in Urea |
Calculation |
Urea to Apply |
|
100 lbs. |
46% |
100/0.46 |
218 lbs. |
Equation 3. Amount of urea to apply.
Now, consider potassium needs. The yield goal indicates that 50 lbs. of K2O will be needed. Potassium chloride, or potash, will be used to achieve this goal. Potash or 0-0-60 contains 60% K2O in every pound of the product, which means that for every 100 lbs., there are 60 lbs. of K2O. Divide 50 lbs. by 60% and the results reveal that 83 lbs. of potassium chloride should be applied (Equation 4).
|
K20 needs |
% K20 in Potash |
Calculation |
Potash to Apply |
|
50 lbs. |
60% |
50/0.60 |
83 lbs. |
Equation 4. Amount of potassium chloride (potash) to apply.
Remember that the methods used to apply these products will vary depending on equipment and timing available to the individual producer. The key is that the methods used should apply the nutrients at a time when they will benefit the crop. As discussed earlier, if you are applying a product such as diammonium phosphate in a pre-plant situation, you need to consider whether the nitrogen being applied will be of any benefit to the crop. In which case, you may want to re-evaluate which products to use to meet your nitrogen needs.
Fertilizer Plan (Liquid Products Only)
A fertilizer plan using dry products only was just developed. Now, consider using only liquid products and the same example of sweet corn crop. Again, the farm needs to have the recommended nutrient amounts to reach its yield goal of 8 ton per acre.
Just as with the dry products, start with phosphorus needs. In this case, use ammonium polyphosphate or 10-34-0 to supply the nutrients. As mentioned earlier, liquid products focus on an application rate of gallons per acre, which means the density of the product is a factor.
For 10-34-0, the density is 11.7 lbs. per gallon and there is 34% of P2O5 in every pound. Therefore, one gallon of 10-34-0 contains 3.98 lbs. of P2O5. You will need 55 lbs. of P2O5 applied to the soil. Dividing the 55 lbs. by 3.98 lbs. per gallon reveals that 14 gallons of 10-34-0 will need to be applied (Equation 5).
|
Density of 10-34-0 |
1 pound of 10-34-0 |
Calculation |
Pounds of P205/gallon |
|
11.7 lbs. per 1 gallon |
34% P205 |
11.7 x 0.34 |
3.98 lbs. |
|
P205 needs |
Lbs. of P205 / gal in |
Calculation |
10-34-0 to Apply |
|
55 lbs. |
3.98 lbs. |
55/3.98 |
14 gallons |
Equation 5. Number of gallons of ammonium polyphosphate to apply.
Now, shift to nitrogen needs, and 120 lbs. will be needed to reach the yield goal. The farm is already applying 14 gallons of 10-34-0, and it contains both phosphorus and nitrogen. You know that one gallon of 10-34-0 has a density of 11.7 lbs. If one pound contains 10% nitrogen and is multiplied by the density of 11.7 lbs., then there are 1.17 lbs. of nitrogen in every gallon. Therefore, in the 14 gallons already being applied, the crop will receive 16 lbs. of nitrogen (see Equation 6). This reduces the 120 lbs. needed to 104 lbs.
|
10-34-0 Applied |
Density of 10-34-0 |
1 pound of 10-34-0 |
Calculation |
Nitrogen Applied |
|
14 gallons |
11.7 lbs. / 1 gallon |
10% |
14 x 11.7 x 0.10 |
16 lbs. |
Equation 6. Amount of nitrogen in ammonium polyphosphate being applied.
To apply the rest of the nitrogen, UAN in the formulation of 28-0-0 will be used. Some UAN products have different formulations, such as 32-0-0. For this example, the farm will use what is commonly called 28%.
28-0-0 has a density of 10.67 lbs. per gallon. Each pound contains 28% nitrogen. Therefore, 10.67 lbs. multiplied by 28% means every gallon contains 2.99 lbs. of nitrogen (Equation 7).
Dividing 104 lbs. by 2.99 lbs. reveals that the remaining nitrogen needs can be met by applying 35 gallons of UAN (Equation 7).
|
Density of 28-0-0 |
1 pound of 28-0-0 |
Calculation |
Pounds of P205/gallon |
|
10.67 lbs. per 1 gallon |
28% N |
10.67 x 0.28 |
2.99 lbs. |
|
Nitrogen needs |
Lbs. of N / gal in 28-0-0 |
Calculation |
28-0-0 to Apply |
|
104 lbs. |
2.99 lbs. |
104/2.99 |
35 gallons |
Equation 7. Number of gallons of ammonium nitrate to apply.
Last, you need to apply 50 lbs. of K20 to meet the potassium needs. To reach the yield goal, potassium thiosulfate (0-0-25-17S) will be used. This product has a density of 12.2 lbs. per gallon and every pound contains 25% of K2O. Multiplying 12.2 lbs. by 25% reveals that every gallon applied will provide 3.05 lbs. of K2O (see Equation 8).
Dividing 50 lbs. by 3.05 lbs. of K20 indicates that 17 gallons should be applied to meet the potassium needs (Equation 8).
|
Density of 0-0-25-17S |
1 pound of 0-0-25-17S |
Calculation |
Pounds of K20/gallon |
|
12.2 lbs. per 1 gallon |
25% P205 |
12.2 x 0.25 |
3.05 lbs. |
|
K20 needs |
Lbs. of K20 / gal in |
Calculation |
0-0-25-17S to Apply |
|
50 lbs. |
3.05 lbs. |
50/3.05 |
17 gallons |
Equation 8. Amount of potassium thiosulfate to apply.
Like dry products, these liquid products meet the nutrient needs set by the farm’s yield goal. A number of dry and liquid products can meet crop needs for your farm. Each offers their own set of advantages and disadvantages.
Advantages & Disadvantages of Fertilizer Products
Dry products offer a higher versatility to mix and fine-tune applications, so more nutrients can be provided per application and reduce costs. Liquid products can be mixed but often require specific mixing directions to avoid chemical reactions that can be damaging to the crop. Dry products are often cheaper on a per acre basis.
However, liquid products have their own advantages. Plants prefer nutrients in forms that are easier to use. Product specific details of nutrient formulations in common liquid fertilizers are typically in these desired forms. While many dry fertilizer products can be delivered just as effectively, they may require microorganisms to convert the nutrients. Liquid products are also easier to handle as they are less bulky and can be easily stored or transported in containers.
Tradeoffs in cost, handling, placement, and application preferences are often what determine which type of fertilizer works best for an individual farm. In fact, many fertilizer plans use a mixture of liquid and dry products to reduce costs and maximize the benefits that each type of product offers. To illustrate this, consider the costs of fertilizer planning.
Costs of a Fertilizer Plan
Identifying the costs of a fertilizer plan involves several factors. These can include the cost of labor, fertilizer products, and product application. The cost of the products themselves tend to be the most variable, while costs for labor and product application are relatively more uniform across acres. Wages per hour for employees typically remain the same and applicators hired for custom work tend to charge a standard rate per acre. For more information on these custom rates, view the MSU Custom Machine and Work Rate Estimates factsheet at https://www.canr.msu.edu/resources/custom-machine-work-costs.
Manure costs will vary based on the source and the nutrient content expected from that source. The costs of commercial products can vary between the quantity of each product purchased and the amount paid for them. Dry products are typically sold in tons, while liquid products can be sold in tons or by the gallon. A comparison of costs at each product’s application rates helps to determine which is more or less expensive.
When liquid products are sold by the ton, a price conversion to gallons will match application rates. Achieve this by using the product density. For example, 28-0-0 UAN has a density of 10.67 lbs. per gallon. 2,000 lbs. divided by 10.67 equals 187 gallons. With a price of $245 per ton divided by 187 gallons, the price becomes $1.31 per gallon (Equation 9).
|
Ton |
Density of 28-0-0 |
Gallons/Ton |
Price/Ton |
Price/Gal |
|
2000 lbs. |
10.67 lbs./gal |
187 gallons |
$245/ton |
$1.31/gallon ($245/187) |
Equation 9. Conversion of price per tons to price per gallons.
To better understand the costs of fertilizer, turn once more to the fertilizer plans for our example sweet corn farm.
Cost of Fertilizer Plan (Dry Products)
In the fertilizer plan with only dry products, nitrogen costs center around the 218 lbs. of urea that will be applied. At a price of $390 per ton, this calculates out to $0.20 per pound. 218 lbs. multiplied by $0.20 results in $24.00 per acre (see Equation 10).
|
Nitrogen Cost |
|||||
|
46-0-0 Applied |
Price Per Ton |
Price Per Pound Conversion |
Price Per Pound |
Cost Per Acre Calculation |
Cost Per Acre |
|
218 lbs. |
$390 |
$390/2000 = |
$0.20/lb. |
218 x $0.20 = |
$43.60/acre |
Equation 10. The cost per acre of Nitrogen in a fertilizer plan of only dry products.
120 lbs. of diammonium phosphate will be spread at a price of $550 per ton. This calculates out to $0.28 per pound. Multiply 120 lbs. by $0.28 to find that the diammonium phosphate will cost $33.60 per acre (Equation 11).
|
Phosphorus P205 Cost |
|||||
|
18-46-0 Applied |
Price Per Ton |
Price Per Pound Calculation |
Price Per Pound |
Cost Per Acre Calculation |
Cost Per Acre |
|
120 lbs. |
$550 |
$550/2000 = |
$0.28/lb. |
120 x $0.28 = |
$33.60/acre |
Equation 11. The cost per acre of Phosphorus in a fertilizer plan of only dry products.
Lastly, potassium costs are based on using potassium chloride at 83 lbs. per acre. Priced at $355 per ton, this calculates to $0.18 per pound or $14.94 per acre (Equation 12).
|
Potassium K20 Cost |
|||||
|
60-0-0 Applied |
Price Per Ton |
Price Per Pound Calculation |
Price Per Pound |
Cost Per Acre Calculation |
Cost Per Acre |
|
83 lbs. |
$355 |
$355/2000 = |
$0.18/lb. |
83 x $0.18 = |
$14.94/acre |
Equation 12. The cost per acre of Potassium in a fertilizer plan of only dry products.
Adding these costs together, the entire dry product fertilizer plan will cost $92.14 per acre (Equation 13).
|
Per Acre Cost |
|||
|
Nitrogen |
P205 |
K20 |
Total Costs |
|
$43.60 |
$33.60 |
$14.94 |
$92.14/Acre |
Equation 13. Total cost of plan with only dry products
How does this affect the overall revenue for the farm?
Considering the yield goal of 8 tons and an estimated market price of $115 per ton at harvest, the potential revenue is $720 per acre. The fertilizer plan with dry products will cost $92.14 per acre, leaving $627.86 to cover additional costs. The additional costs might include seed, chemicals, and rent, as well as other costs.
For example, if seed cost is $100 per acre, chemicals $50 per acre, and land rent is $150 per acre, this leaves $327.86 to cover repairs, fuel, insurance, and any overhead costs that remain (Table 4).
|
Revenue (per acre) |
|||
|
8 tons |
x $115 |
= $720 |
|
|
Fertilizer Plan (Dry products) |
$92.14 |
||
|
Remaining Revenue after Fertilizer |
= $627.86 |
||
|
|
|
||
|
Cover Additional Costs? (per acre) |
|||
|
Seed |
= $100 |
||
|
Chemicals |
= $50 |
||
|
Land Rent |
= $150 |
||
|
Other Variable and Fixed Costs |
= $200 |
||
|
Remaining Revenue Costs (per acre) |
= $127.86 |
||
Table 4. Profits of fertilizer plan with only dry products
Is $167.66 a reasonable amount of revenue to cover those expenses for the farm? Is that enough remaining revenue to put toward any family living or debt payments that the farm would be expected to pay?
Cost of Nutrient Fertilizer (Liquid Products)
Now, look at the cost of the fertilizer plan with liquid products.
For nitrogen needs, 40 gallons of UAN (28-0-0) will be used at a price of $245 per ton. The tons need to be converted to gallons to find a price per acre. Using the density of the product and dividing by the pounds within a ton reveals there are 187 gallons per ton. Dividing the price of $245 per ton by 187 gallons equals a price per gallon of $1.31. Using the application amount of 40 gallons multiplied by $1.31 equals a cost of $52.40 per acre (Equation 14).
|
Nitrogen Cost |
|||||||
|
Price/Ton |
Ton to Gallons Conversion |
Gallons/Ton |
Cost/Gallon Calculation |
Cost Per Gallon |
28-0-0 To Apply |
Cost/Acre Calculation |
Cost/Acre |
|
$245 |
2000/10.67 = |
187 gallons |
$245/187 = |
$1.31/gallon |
35 gallons |
35 x $1.31 = |
$45.85/acre |
Equation 14. The cost per acre of Nitrogen in a fertilizer plan of only liquid products.
The farm plans to apply 14 gallons of ammonium polyphosphate (10-34-0) at a price of $455 per ton. There are 171 gallons per ton of this product. This means each gallon will cost $2.66. The cost of those 14 gallons is $37.25 per acre (Equation 15).
|
Phosphorus P205 Cost |
|||||||
|
Price/Ton |
Ton to Gallons Conversion |
Gallons/Ton |
Cost/Gallon Calculation |
Cost Per Gallon |
10-34-0 To Apply |
Cost/Acre Calculation |
Cost/Acre |
|
$455 |
2000/11.7 = |
171 gallons |
$455/171 = |
$2.66/gallon |
14 gallons |
14 x $2.66 = |
$37.24/acre |
Equation 15. The cost per acre of Phosphorus in a fertilizer plan of only liquid products.
Lastly, look at the potassium needs using potassium thiosulfate. The farm is applying 13 gallons at a cost of $630 per ton. Using the density factor of 12.2 pounds per gallon, there are 164 gallons in each ton of this product. Dividing the price of $630 per ton by 164 gallons results in a cost of $3.84 per gallon. Multiply the 13 gallons by $3.84. This equals a per acre cost of $49.94 (Equation 16).
|
Potassium K20 Cost |
|||||||
|
Price/Ton |
Ton to Gallons Conversion |
Gallons Per Ton |
Cost/Gallon Calculation |
Cost Per Gallon |
0-0-25-17S To Apply |
Cost/Acre Calculation |
Cost/Acre |
|
$630 |
2000/12.2 = |
164 gallons |
$630/164 = |
$3.84 per gallon |
17 gallons |
17 x $3.84 = |
$65.28/acre |
Equation 16. The cost per acre of Potassium in a fertilizer plan of only liquid products.
Adding these costs together, using only liquid products will cost $148.37 per acre (Equation 17).
|
Per Acre Cost |
|||
|
Nitrogen |
P205 |
K20 |
Total Costs |
|
$45.85 |
$37.24 |
$65.28 |
$148.37/Acre |
Equation 17. Total cost of plan with only liquid products
How does the cost of the fertilizer plan affect the overall revenue for the farm?
The expected revenue remains the same as the previous example with only dry products. The yield goal of 8 tons multiplied by an estimated $115 per ton equals $720 in potential revenue. The fertilizer plan with liquid products will cost $148.37 per acre, leaving $571.63 to cover additional costs. These additional costs of seed, chemicals, and land rent remain the same from the dry products example (Table 5).
|
Revenue (per acre) |
|||
|
8 tons |
x $115 |
= $720 |
|
|
Fertilizer Plan (Liquid products) |
$148.37 |
||
|
Remaining Revenue after Fertilizer |
= $571.63 |
||
|
|
|
||
|
Cover Additional Costs? (per acre) |
|||
|
Seed |
= $100 |
||
|
Chemicals |
= $50 |
||
|
Land Rent |
= $150 |
||
|
Other Variable and Fixed Costs |
= $200 |
||
|
Remaining Revenue after Seed, Chemicals, and Rent Costs (per acre) |
= $71.63 |
||
Table 5. Profits of fertilizer plan with only liquid products
The same questions from the dry products example are also asked. Is $71.63 a reasonable amount to cover the costs of family living or debt?
As you consider the cost of these fertilizer plans, recall that using only dry products will cost $92.14 per acre. In comparison, only using liquid products will cost $148.37 per acre. This is a difference of $56.23 per acre between the two example plans.
This difference helps to illustrate why producers seek to use a mixture of both dry and liquid products. As the benefits of each product are considered, some nutrients can best be provided using dry products, while other nutrients by liquid products. By using both types of products, the cost of the fertilizer plan begins to shift somewhere between these two values and erode away the $56.23 per acre difference in the examples. Finding the right combination of products that will meet the nutrient needs at the lowest possible cost to your farm.
Break-Evens of Fertilizer Plan
Another way to view the cost of these fertilizer plans is to consider them in a break-even position. The following focuses on a break-even for price and a break-even for yield.
For the dry products, divide the cost of the plan by the yield goal of 8 tons. This calculates a value of $11.52 per ton needed to cover costs. Alternatively, if the farm considers a market price of $115 per ton, it will need to sell 0.8 tons at that price to cover the costs (Equation 18).
|
|
Cost of Plan |
Yield Goal or |
Calculation |
Break-Even |
|
Price |
$92.14/acre |
8 tons |
$92.14 ÷ 8 |
$11.52/ton |
|
Yield |
$92.14/acre |
$115 per ton |
$92.14 ÷ $115 |
0.8 tons |
Equation 18. Break-evens of price and yield for fertilizer plan (dry only).
For the liquid products, look again at both price and yield break-evens. For the price break-even, $18.55 per ton is needed to cover costs. For break-even yield, the farm will need to sell 1.29 tons to cover the costs (Equation 19).
|
|
Cost of Plan |
Yield Goal or |
Calculation |
Break-Even |
|
Price |
$148.37/acre |
8 tons |
$148.37 ÷ 8 |
$18.55/ton |
|
Yield |
$148.37/acre |
$115 per ton |
$148.37 ÷ $115 |
1.29 tons |
Equation 19. Break-evens of price and yield for fertilizer plan (liquid only).
Take a closer look at the break-evens for both fertilizer plans. First, consider the break-even price and the $7.03 per ton difference between dry and liquid programs (Table 6). As you think back to the advantages of liquid products, is $7.03 per ton acceptable for the benefits it offers? Or does the cost of the plan outweigh the benefits?
|
|
Cost of Plan |
Yield Goal |
Calculation |
Break-Even |
Difference |
|
Price |
$92.14/acre |
8 tons |
$92.14 ÷ 8 |
$11.52/ton |
$7.03/ton |
|
Price |
$148.37/acre |
8 tons |
$148.37 ÷ 8 |
$18.55/ton |
Table 6. Break-even price comparison of dry and liquid fertilizer plans.
Use a similar thought process with break-even yield. In comparison, the dry fertilizer plan will need 0.49 ton less than the liquid program to cover costs (Table 7). With the advantages and disadvantages of dry products in mind, would saving the revenue of 0.49 tons for other costs be best?
|
|
Cost of Plan |
Market Price |
Calculation |
Break-Even |
Difference |
|
Yield |
$92.14/acre |
$115 per ton |
$92.14 ÷ $115 |
0.8 tons |
0.49 tons |
|
Yield |
$148.37/acre |
$115 per ton |
$148.37 ÷ $115 |
1.29 tons |
Table 7. Break-even yield comparison of dry and liquid fertilizer plans.
Looking at break-evens for both price and yield illustrates the importance of understanding how much more a fertilizer plan will need from the marketing and production activities on the farm. By mixing both dry and liquid products in a plan, the extra burden on marketing and production activities is often reduced. These activities can include the extra cost of equipment or the need to outsource applications.
The final step is to consider the same questions in relation to the farm’s break-even for all costs, not just fertilizer. Understanding this comparison is where your role as a manager becomes crucial to your farm’s success. Fertilizer is just one of several operating inputs that you’ll need to purchase and pay for with your harvested production. Deciding whether an increase in cost is acceptable depends on what remains to pay for those other inputs. That level of acceptance can change with both the cost of inputs and the value of your harvested production.
As you think about fertilizer planning, remember that detailed planning can help reduce the impacts to revenue. You can accomplish this by relying on accurate, routine soil testing to identify what nutrients are already present in the soil. Taking advantage of those available nutrients can reduce the amount of fertilizer to apply and still ensure that the plan meets your intended yield goals.
Most importantly, a detailed fertilizer plan helps to meet the nutrient needs of your crop at the lowest possible cost.