Seed Selection: Beyond Yield and Disease Resistance (Corn Edition)
DOWNLOADJuly 10, 2025 - Jonathan LaPorte
 Print
Print Email
EmailSelecting the right seed for your farm starts and stops with profitability. You want to select two or three hybrids that are adaptable and will maximize yields on your farm. When selecting hybrids, the top two criteria should be yield potential followed by disease resistance. Select high yielding hybrids that are adapted to your soil type and production practices. Tar Spot, Northern Corn Leaf Blight and Gray Leaf Spot are the main foliar disease problems facing the Michigan corn industry. Major ear mold concerns are with Gibberella and Fusarium. Hybrids should be selected that have some resistance to key foliar and ear mold diseases.
Use hybrid performance trial data, your local seed dealer as well as your own experience with different hybrids. Use data from multiple locations and multiple years. Hybrids that perform consistently across locations are usually well adapted over a wide range of climates and conditions. Alternatively, evaluate data for testing locations nearest to you and your soil types. Make sure you consider at least three years of data for each hybrid. This will provide insight to how a hybrid performs over different weather scenarios. No two years are the same. Hybrids that are consistently performing at the top indicate that they are well adapted to various climates.
Another key to profitability is also considering the economic returns related to seed and harvest costs. Those costs include seed purchases, test weight, moisture shrink loss, and drying charges.
Cost Per Bag vs. Cost Per Acre
Identifying seed costs begins with knowing the price of an individual hybrid. Seed is sold in fairly standardized units regardless of packaging (bag, tote, or box). For corn, seed is sold in equivalent per bag units or 80,000 kernels per bag. The use of price per bag information is your first comparison point between hybrid options.
In the following example, a seed box contains four million kernels of seed corn or 50 bags at 80,000 kernels per bag. The price per bag of the individual hybrid is valued at $300. To find the cost of the seed box, multiply the price per bag of the individual hybrid by 50 bags. Therefore, $300 x 50 = $15,000.
The second comparison between hybrids is the trait packages. Some hybrids you’ll consider will have multiple traits (insect and herbicide). While some hybrids will only offer certain traits (herbicide only). Understanding what traits are offered helps to differentiate between hybrids and their potential value to your farm.
Table 1. Example comparison of corn hybrids, traits, and prices.
|
Corn Hybrids |
Insect Traits |
Herbicide Traits |
Price Per Bag |
|
Hybrid 1 |
Cry1Ab – Cry34Ab1 |
Glyphosate, Glufosinate, 2,4-D |
$320 |
|
Hybrid 2 |
Cry1Ab |
Glyphosate |
$280 |
As Table 1 outlines, hybrid 1 offers multiple modes-of-action on insects and is tolerant of multiple herbicides. The hybrid is listed at a price per bag of $320. Hybrid 2 offers only one insect trait and is only tolerant to glyphosate herbicides. The hybrid is listed at a price per bag of $280. At a difference of $40 per bag, hybrid 1 may appear to offer more crop valuable protection. However, if you have low insect pressure and plan to only apply glyphosate, hybrid 2 may be of better value.
Desired planting population can be equally impactful as the price per bag. Therefore, planting rates should be your next comparison point between hybrids. Continuing with the same two hybrid examples, let’s consider differences in planting rates. To fully consider differences in planting rates, it helps to evaluate how rates affect acres planted per bag of seed. A simple calculation is used to determine acres per bag:
Seeds Per Bag ÷ Planting Rate = Acres Per Bag
For example, 80,000 ÷ 28,000 = 2.86 acres per bag. Once you know how many acres can be planted per bag, a comparison of costs can help determine cost per acre. The calculation to determine cost per acre is:
Cost Per Bag ÷ Acres Per Bag = Cost Per Acre
If the cost per bag of the hybrid is $320, divide the cost by 2.86 acres to arrive at a cost per acre of $111.89. Let’s look at an example of how these calculations are used to compare hybrids (Table 2).
As Table 2 outlines, hybrid 1 has a planting rate of 28,000 kernels (plants) per acre. Divided by 80,000 kernels per bag, one bag of hybrid 1 will plant 2.86 acres. At a cost per bag of $320, the cost of planting hybrid 1 would be $111.89 per acre. In comparison, hybrid 2 has a planting rate of 32,000 kernels (plants) per acre. The same calculation reveals one bag of hybrid 2 will plant 2.50 acres. At a cost of $280 per bag, the cost of planting hybrid 2 would be $112.00 per acre.
Table 2. Example comparison of planting rates on corn hybrid costs.
|
Corn Hybrids |
Price |
Recommended Planting Rates |
Kernels |
Acres Per Bag |
Cost Per Acre |
|
Hybrid 1 |
$320 |
28,000 |
80,000 |
(80,000 ÷ 28,000) |
$320 ÷ 2.86 |
|
Hybrid 2 |
$280 |
32,000 |
80,000 |
(80,000 ÷ 32,000) |
$280 ÷ 2.50 |
Adjusting for planting rates, the difference between hybrids is only $0.11 per acre. Which hybrid should you choose?
The answer lies in reviewing your farm’s criteria for what it needs out of a corn hybrid. Growth expectations, or factors, how well a plant will produce harvestable grain, are key components of seed selection. Growth factors become even more important once you begin to look at the final cost per acre between hybrids. In the above example, it is assumed that growth factors are similar between the two hybrids. If that were not the case, the choice could easily rest on which hybrid’s attributes best meet your intended use or needs on the farm. To learn more about growth factors, review Bulletin E-3430: How to Read a Seed Guide (Corn Edition) (https://www.canr.msu.edu/resources/bulletin-e-3430-how-to-read-a-seed-guide-corn-edition).
Alternatively, you may have multiple needs on the farm that could be served by both hybrids. Perhaps hybrid 1 is best suited to particular fields where specific weed or insect pressure has been more notable, whereas hybrid 2 is better suited to a different set of fields that meet separate criteria. For example, hybrid 2 could have a better emergence and seedling vigor rating, making it ideal for earlier planting dates. In many cases, farms will also hedge their investment and look at purchasing multiple options to maximize their potential corn crop.
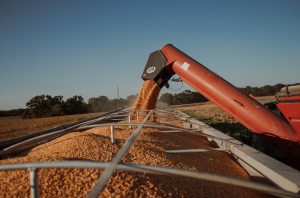
Harvest Cost Considerations
Harvest time costs can also be helpful when comparing corn hybrids. Commercial grain buyers will grade corn bushels based on a number of factors. Factors can include test weight, moisture content, kernel damage, heat damage from drying, and foreign material. Grain that is sold without meeting these standards is discounted by fee or reduced bushels. The most common and impactful with regard to seed selection are standard test weight and ideal storage moisture.
Trial results will list the test weight and moisture content of each hybrid. When comparing hybrids, it can be helpful to convert test weight and moisture levels to potential discounts to give you a clear indication of harvest time costs across hybrids. By combining seed costs with potential revenues, you can then identify hybrids that will perform and be profitable for your farm.
Test Weight
Test weight is used to determine the standard volume of harvested grain. In the case of corn, 56-pounds is used to determine the standard weight for each bushel. If test weight is below 56-pounds, less bushels exist compared to the standard test weight.
Bushel adjustments can be made at grain elevators for test weight when delivering bushels for sale. However, shrink factors are more often used as a replacement for adjusting bushels by test weight. Test weight and moisture content are inversely related. Research indicates that the higher the grain moisture, the lower the test weight. Therefore, a shrink factor that adjusts wet bushels to dry bushels is considered a suitable adjustment for lower test weight. However, even if a test weight bushel adjustment is not made, a price discount for low test weight is still charged.
In most cases, most grain buyers don’t begin to charge a fee until the test weight falls below 54 pounds. The discounts are typically based on a range between each pound of test weight (Table 3).
Table 3. Example Test Weight Discount Chart
|
Test Weight |
53.9-53 |
52.9-52 |
51.9-51 |
50.9-50 |
Below 50 |
|
Discount Fee |
$0.02 |
$0.03 |
$0.04 |
$0.05 |
$0.06+ |
Once a discount fee is identified, it is subtracted from the initial sale price. The adjusted price calculation is illustrated as:
Initial Sale Price – Discount Fee = Adjusted Sales Price
See Table 4 for an example of calculating the net result of a test weight discount fee.
Table 4. Example of a discount fee on adjusted corn bushels with low test weight.
|
Corn Hybrids |
Initial Sale Price |
Test Weight |
Discount Fee |
Adjusted Sale Price |
|
Hybrid 1 |
$4.25 per bushel |
53 lbs. |
$0.02 per bushel |
$4.25 - $0.02 = $4.23 |
|
Hybrid 2 |
$4.25 per bushel |
52 lbs. |
$0.03 per bushel |
$4.25 - $0.03 = $4.22 |
Table 4 illustrates where grain buyers would assess a discount fee on delivered bushels. Using an initial sale price of $4.25 per bushel, the final sale price for hybrid 1 is discounted by $0.02 per bushel to equal $4.23. Hybrid 2 has a discount of $0.03 per bushel for the lower test weight and a net price of $4.22 per bushel.
For more information on test weight discount, review Grain Test Weight Considerations for Corn from Purdue University (https://www.agry.purdue.edu/ext/corn/news/timeless/testweight.html).
Moisture Content Discount
A moisture content discount is based on delivery of corn that has a moisture content greater than 15.5%. Corn is able to be efficiently and safely stored when its moisture content is 15.5% or lower. The process of drying corn to an ideal storage moisture of 15.5% is passed from the grain buyer on to the producer.
Two distinct methods are used to assess a moisture discount. The first method is a price discount based on percentage points of moisture above 15.5%. The second method is a discount fee based on drying cost and a shrink factor to adjust wet bushels to dry bushels. Let’s explore both methods of moisture discounts briefly.
Method #1: Price Discount
The price discount method can be calculated using the following equation:
[(Actual Percentage Points of Moisture – Ideal Percentage Points of Moisture) x Percentage Discount Factor] x Anticipated Sales Price = Price Discount
The price discount can then be subtracted from the anticipated sales price. Multiply the final price after a moisture discount by your delivered bushels to determine a net sale value. It is often easier to use this method by breaking down each part of the equation into different steps (Table 5).
Table 5. Example of discounting corn price per bushel based on moisture content.
|
Corn Hybrids |
Hybrid 1 |
Hybrid 2 |
|
Delivered bushels |
900 bushels |
900 bushels |
|
Moisture of delivered bushels |
20.5% |
22.5% |
|
Point of moisture difference between delivered moisture and 15.5% for ideal storage |
20.5 – 15.5 = 5.0 percentage points |
22.5 – 15.5 = 7.0 percentage points |
|
Percentage discount |
2% |
2% |
|
Total moisture discount percentage |
5.0% x 2.0% = 10% |
7.0% x 2.0% = 14% |
|
Anticipated price |
$4.25 |
$4.25 |
|
Cost of total moisture discount |
$4.25 x 10% = $0.425 |
$4.25 x 14% = $0.60 |
|
Final price after moisture discount |
$4.25 - $0.425 = $3.825 |
$4.25 - $0.60 = $3.66 |
|
Net Sale Value |
900 x $3.825 = $3,442.50 |
900 x $3.66 = $3,294.00 |
Table 5 outlines the method of a price discount based on moisture content. Using the same 900 bushels from previous examples, the bushels are delivered with a moisture content of 20.5% for hybrid 1 and 22.5% for hybrid 2. The moisture reading for hybrid 1 is 5 percentage points higher than the ideal storage moisture of 15.5%. Hybrid 2 has 7 percentage points higher than ideal storage. The grain buyer assesses a percentage discount of 2% for every point above 15.5%. The total moisture discount for hybrid 1 is 10% (5% x 2%) and multiplied against the anticipated price per bushel of $4.25. The result is a reduction in price of $0.425 ($4.25 x 10%) for a net price of $3.825 per bushel. Hybrid 2 has a total moisture discount of 14% (7% x 2%), a reduced price of $0.60 ($4.25 x 14%) for a net of $3.66 per bushel.
Method #2: Discount Fee Based on Drying Costs and Shrink Factor
To outline the method of using a discount fee for drying cost and shrink factors, we’ll use a three-step equation. The first step is to calculate the drying costs using the following formula:
[(Actual Percentage Points of Moisture – Ideal Percentage Points of Moisture) x Drying Cost Per Bushels] x Delivered Bushels = Total Drying Costs
Table 6. Example of drying costs on corn bushels based on moisture content.
|
Corn Hybrids |
Hybrid 1 |
Hybrid 2 |
|
Delivered bushels |
900 bushels |
900 bushels |
|
Moisture of delivered bushels |
20.5% |
22.5% |
|
Point of moisture difference between delivered moisture and 15.5% for ideal storage |
20.5 – 15.5 = 5.0 percentage points |
22.5 – 15.5 = 7.0 percentage points |
|
Drying cost |
$0.065 per point |
$0.065 per point |
|
Drying charge |
5.0 x $0.065 = $0.33 per bushel |
7.0 x $0.065 = $0.46 per bushel |
|
Total drying charge on delivered bushels |
$0.33 x 900 = $297.00 |
$0.46 x 900 = $409.50 |
The first step of the calculation is illustrated in Table 6. Our example grain buyer places a drying cost of $0.065 per point moisture content above 15.5%. With a difference of 5 percentage points from delivering hybrid 1 at 20.5%, the drying charge per bushel is $0.33. Multiplied by the original amount of 900 bushels, the total drying charge is $297.00. For hybrid 2, a moisture content of 22.5% equals a drying charge of $0.46. Multiplied by 900 bushels, the total drying charge for hybrid 2 is $409.50.
The second step is to calculate the bushel reduction from shrink factors using the following formula:
[(Actual Percentage Points of Moisture – Ideal Percentage Points of Moisture) x Shrink Factor] x Delivered Bushels = Shrink Adjustment Bushels
The shrink adjustment is then subtracted from the delivered bushels for an adjusted total. Table 7 outlines how corn bushels would be adjusted using a shrink factor.
Table 7. Example of shrink factor adjustment of corn bushels based on moisture content.
|
Corn Hybrids |
Hybrid 1 |
Hybrid 2 |
|
Delivered bushels |
900 bushels |
900 bushels |
|
Moisture of delivered bushels |
20.5% |
22.5% |
|
Point of moisture difference between delivered moisture and 15.5% for ideal storage |
20.5 – 15.5 = 5.0 percentage points |
22.5 – 15.5 = 7.0 percentage points |
|
Shrink factor |
2.1% per point |
3.5% per point |
|
Shrink adjustment on bushels |
5.0 x 2.1% x 900 = 94.50 bushels |
7.0 x 3.5% x 900 = 220.50 bushels |
|
Total bushels after shrink adjustment |
900 – 94.50 = 805.50 bushels |
900 – 220.50 = 679.50 bushels |
With a shrink factor of 2.1% per point, the 5.0 difference in moisture for hybrid 1 leads to a 94.50 bushels reduction (5.0 x 2.1% x 900). The result is that 900 bushels delivered turns into 805.50 bushels. For hybrid 2, the 7.0 difference in moisture is assessed at a higher shrink factor of 3.5%. The higher shrink factor is used to account for the expected lower test weight after excess moisture is removed. The shrink factor results in a reduction of 220.50 bushels for hybrid 1 or 679.50 delivered bushels. Note: Shrink factors are normally provided by grain buyers as part of a discount schedule.
The final step is to combine both the drying cost charge and the bushel reduction into a net sale value. The combination of steps is illustrated in the following equation:
(Shrink Adjusted Bushels x Anticipated Sale Price) – Drying Costs = Net Sale Value
Table 8. Example of net sale value of corn bushels for hybrid 1 after drying cost and shrink factor adjustments.
|
Shrink Adjusted Bushels |
Price Received |
Gross Sale Value |
Drying Costs |
Net Sale Value |
|
805.50 |
$4.25 |
805.50 x $4.25 = $3,423.38 |
$297.00 ($0.33 on 900 delivered bushels) |
$3,423.38 - $297.00 |
Table 8 shows the previous step examples to illustrate calculating the net sale value. As the table outlines, adjusted bushels of 805.50 are priced at $4.25 per bushel. The gross sale value is $3,423.38. Subtract the drying costs of $297.00 from Table 6 for a net sale value of $3,126.38.
Table 9. Example of net sale value of corn bushels for hybrid 2 after drying cost and shrink factor adjustments.
|
Shrink Adjusted Bushels |
Price Received |
Gross Sale Value |
Drying Costs |
Net Sale Value |
|
679.50 |
$4.25 |
679.50 x $4.25 = $2,887.88 |
$409.50 ($0.46 on 900 delivered bushels) |
$2,887.88 - $409.50 |
Table 9 shows the previous step examples to illustrate calculating the net sale value. As the table outlines, adjusted bushels of 679.50 are priced at $4.25 per bushel. The gross sale value is $2,887.88. Subtract the drying costs of $409.50 from Table 6 for a net sale value of $2,478.38.
In comparing the price discount method (Table 5) versus the drying cost and shrink factor method (Tables 7-10), price discount appears to offer a more favorable net sale value. However, which method is more favorable depends on individual grain buyer discount rates, drying costs, and shrink factors at any given time. Always visit with prospective grain buyers to identify their discount schedules each season, especially if these methods are used to aid in your seed selection decisions. The potential discounts can offer an indication of profitability between the hybrids you are interested in buying.
For more information on calculating moisture discount costs for your farm, visit Corn Drying and Shrink Comparison, a document from Iowa State University (https://www.extension.iastate.edu/agdm/crops/html/a2-32.html).
Summarizing Harvest Costs
To illustrate the impact of quality grades on corn hybrids, below is a summary of the total discounts from the previous examples.
Table 10. Summary of revenue impacts from quality discounts on corn (per bushel).
|
|
Step #1: Price Discounts |
Step #1: Price Discounts |
|
Corn Hybrids |
Hybrid 1 |
Hybrid 2 |
|
Initial sales price |
$4.25 |
$4.25 |
|
Test weight discount |
-$0.02 |
-$0.03 |
|
Moisture content – drying cost |
-$0.33 |
-$0.46 |
|
Total discounts |
-$0.33 - $0.02 = -$0.35 |
-$0.46 - $0.03 = -$0.49 |
|
Net sales price after discounts |
$4.25 - $0.35 = $3.90 |
$4.25 - $0.49 = $3.76 |
|
|
Step #2: Bushel Discounts |
Step #2: Bushel Discounts |
|
Delivered bushels |
900 bushels |
900 bushels |
|
Moisture content – shrink factor |
-94.50 bushels |
-220.50 bushels |
|
Net bushels |
900 – 94.50 = 805.50 bushels |
900 – 220.50 = 679.50 bushels |
|
|
Net Sales |
Net Sales |
|
Net sales |
900 bushels x $4.25 = $3,825.00 |
900 bushels x $4.25 = $3,825.00 |
|
Net sales |
805.50 bushels x $3.90 = $3,141.45 |
679.50 bushels x $3.76 = $2,554.92 |
|
Revenue loss from quality discounts |
$3,825.00 – $3,141.45 = $683.55 |
$3,825.00 – $2,554.92 = $1,270.08 |
Table 10 illustrates the total discounts from quality adjustments. In step #1, price discounts total $0.35 per bushel for hybrid 1 and $0.46 per bushel for hybrid 2, based on low test weight and drying cost for high moisture. Subtracted from the initial sales price of $4.25, the net result is a lower sales price of $3.90 for hybrid 1 and $3.76 for hybrid 2. High moisture also led to a shrink factor that lowered the total bushels from 900 to 805.50 bushels delivered for hybrid 1 and 679.50 bushels for hybrid 2. If the delivered corn had met all of the quality standards, the net revenue would have been $3,825.00 for both hybrids. Instead, the net sales after discounts for hybrid 1 are $3,141.45 or a loss of $683.55. For hybrid 2, the net sales after discounts are $2,554.92 or a loss of $1,270.08.
Grain quality is an important aspect of selecting the right seed for your farm. Corn hybrids that don’t meet standards for test weight and moisture content can see significant discounts. Economic returns related to harvest costs are why the key to profitability when selecting seed is to consider more than just yields.
Seed Selection Resources
In addition to the content found in this fact sheet, MSU Extension also offers a decision tool to help calculate these values. The Seed Selection Cost Comparison Decision Tool helps to identify which options maximize production and profitability. Tool comparisons provide a ranking for each seed variety based on yield and economic returns. These rankings illustrate top production and profitability options to consider in making seed purchases. To download the Seed Selection Cost Comparison Decision Tool, visit: https://www.canr.msu.edu/resources/seed-selection-cost-comparison-decision-tool
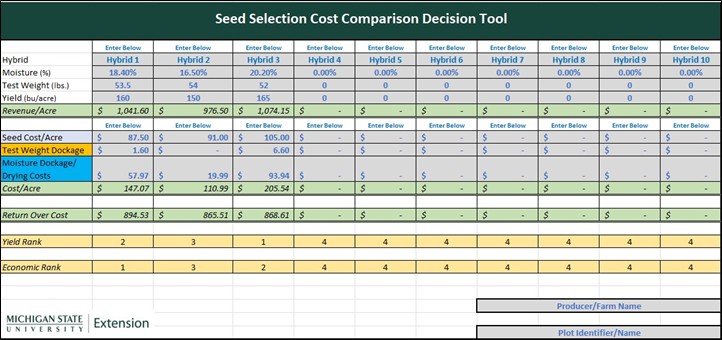
Figure 1. Screenshot of the MSU Seed Selection Cost Comparison Decision Tool.
Often, much of the information needed to select corn hybrids can be found in the seed guide. For information on how to read a seed guide, review MSU Extension’s bulletin E-3430: How to Read a Seed Guide (Corn Edition) (www.canr.msu.edu/resources/bulletin-e-3430-how-to-read-a-seed-guide-corn-edition).