Water Withdrawals and Water Use in Michigan (WQ62)
DOWNLOADOctober 20, 2015 - Saichon Seedang
 Print
Print Email
EmailIntroduction
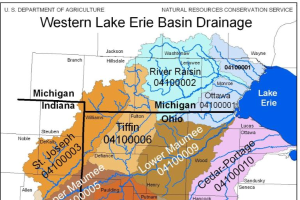
Maintaining accurate information about the amount of water used in Michigan and the purposes of its use is important for effective water resource management. Understanding water use by different sectors can help with planning for economic development, land use and ecosystem protection. Also, creating and maintaining an inventory of water withdrawals and water uses is an important part of complying with the Great Lakes–St. Lawrence River Basin Water Resources Compact (the Compact). As part of i
mplementing the Compact and facilitating water resource management in Michigan, additions to Michigan’s body of water law require that all water users who withdraw on average more than 100,000 gallons per day over any consecutive 30-day period report annually the amount of water withdrawn from surface water or groundwater sources. The Michigan Department of Environmental Quality (MDEQ) maintains this inventory for specific categories of water users through its Water Use Reporting Program.
Even before the changes to Michigan’s water law, the MDEQ compiled and reported water withdrawals by thermoelectric power plants, self-supplied industries, irrigators and public water supply systems. The most recent year for which information for all categories was released was 2004. During that year, these water users together withdrew more than 10,948 million gallons of water per day. Methods applied by the United States Geological Survey (USGS) add domestic uses of residential wells to the mix; the additional 250 million gallons per day (MGD) withdrawn from residential wells brings the total estimated water withdrawals for 2004 to 11,198MGD or more than four trillion total gallons. The Great Lakes, inland lakes and streams, and groundwater supply Michigan’s water.
The MDEQ provides the water withdrawal data collected to the USGS National Water Use Information Program (NWUIP) and to the Great Lakes Commission for its annual Great Lakes Regional Water Use Database. The NWUIP generates comprehensive national, state and county water-use reports every five years. The Great Lakes Commission reports the data for each state and for the basin of each Great Lake.
In this document, we review water use by principal user categories in Michigan and the ways in which that use is measured or estimated and reported. We first clarify how the terms water use and water withdrawal are used in Michigan’s Water Use Reporting Program and by other entities that compile and report water-use information. We then describe the various types of water use that are tracked. We summarize the methods used to compile water-use information and discuss ways in which actual water withdrawals may be over or under reported. Finally, we present water withdrawal data for Michigan for 2004.
Water Withdrawal and Water Use
The MDEQ collects water withdrawal information from all public water suppliers and from self-supplied users with the capacity to withdraw more than 100,000 gallons per day (GPD) over any consecutive 30-day period. While reporting entities complete water-use reports,the MDEQ reports annual water withdrawals for major water uses. The distinction between withdrawals and use is significant in some cases, but that distinction is often lost when the terms are used. For example, the USGS defines water use as water withdrawn or diverted from surface water and ground water sources (Hutson et al., 2004). Equating water withdrawals with water use is misleading when not all water withdrawn reaches its intended user. A considerable amount of water withdrawn by public water supply systems does not reach end users. Losses of 10 to 20 percent through leakages from public water supply systems (called conveyance losses) are considered normal, and in some locations, as much as 50 percent of water distributed is being lost from aging infrastructure (USEPA, 2009). The distinction is important because estimates of water demand for certain uses may be inaccurate if they are generated using data on water withdrawn and distributed by public water supplies rather than water actually used by those being served.
Distinguishing between withdrawal and use may also be important for understanding the impact of withdrawals on hydrologic systems. In particular, estimates of consumptive use (defined in Box 1) convey how much of the water withdrawn is returned to its source and how much is removed to another watershed. However, calculating consumptive use is challenging because information on return flows and conveyance losses is required but difficult to obtain.
Box 1. Definitions of TermsConsumptive use – that part of water withdrawn that is evaporated, transpired, incorporated into products or crops, consumed by humans or livestock, or otherwise removed from the immediate water environment.Consumptive-use values may be calculated by subtracting return flow and conveyance losses from withdrawals. Conveyance loss – water that is lost in transit from a pipe, canal, conduit or ditch by leakage or evaporation. Generally, the water is not available for further use; however, leakage from an irrigation ditch, for example, may percolate to groundwater and be available for further use. In-stream use (also called non-withdrawal use or in-channel use) – water that is used, but not withdrawn, from a surface water source for purposes such as hydroelectric power generation, navigation, water quality improvement, fish propagation and recreation. Off-stream use (also called withdrawal use) – water withdrawn or diverted from groundwater or surface water sources for aquaculture, commercial, domestic self-supply, industrial, irrigation, livestock, mining, public supply, thermoelectric power and other uses. Return flow – water that reaches a groundwater or surface water source after release from the point of use and thus becomes available for further use. Source: Hutson et al., 2004 and Solley, Pierce & Perlman, 1998 |
Because data on return flows and conveyance losses is problematic, consumptive use is generally estimated with consumptive-use coefficients. These coefficients indicate “the percentage of water removed from the immediate environment by evaporation, transpiration, incorporation into products or crops, or consumption by humans or livestock” (Shaffer & Runkle, 2007). Coefficients are calculated periodically based on data collected by a few self-supplied users who have measured withdrawals and return flows or by public supply facilities that have measured and/or estimated deliveries, releases to sewage-treatment facilities, leakages, in-flows and return flows. Then, those coefficients are extrapolated to similar uses in other locations. Shaffer and Runkle completed a comprehensive review of consumptive-use coefficients reported in the literature for the Great Lakes Basin and climatically similar areas. Their summary provided the values reported in Table 1.
Table 1. Consumptive-use coefficients by water-use category for the Great Lake Basin
|
Water-use category |
Median value (percent) |
Range of values (percent) |
|
Domestic and public supply |
12 |
0-74 |
|
Industrial |
10 |
0-35 |
|
Thermoelectric power |
2 |
0-21 |
|
Irrigation |
90 |
70-100 |
|
Livestock |
83 |
0-100 |
|
Commercial |
10 |
4-26 |
|
Mining |
10 |
0-58 |
Source: Shaffer & Runkle, 2007
Consumptive-use coefficients for agriculture (irrigation and livestock uses) are the largest compared to other uses. The range of values reported for irrigation reflectsdifferences in irrigation technology (for example, flood, sprinkler or drip irrigation) and differences in types of plants being watered. The large range of consumptiveuse coefficient values for livestock reflects the large number of animal species included and substantial differences in how water is used for different species and different production practices. Consumptive-use coefficients are smallest for thermoelectric power plants, many of which return cooling water to a surface water source with very little evaporation in the process.
Water-Use Sectors in Michigan
The MDEQ reported water withdrawals in 2004 for four broad categories: public supply, irrigation, industrial use and thermoelectric power generation. Irrigation uses are divided into agricultural irrigation and irrigation of golf courses. Public supply refers to fresh water withdrawn by community public water suppliers that furnish water to at least 25 people or have a minimum of 15 service connections. Public water supply is delivered to community users for domestic, commercial and industrial purposes. Public supply also includes public uses such as fire fighting and street washing, and water for parks and other community uses. Water withdrawals are reported by public water suppliers to the MDEQ either monthlyor annually (depending upon size) along with the water quality information required by Michigan’s Safe Drinking Water Act. Industrial water use refers to self-supplied withdrawals of water for industrial processing, washing, cooling and other purposes. Although most industries in Michigan receive water from public suppliers, there are some industrial self-supplied facilities. In 2004, industries in primary metals, paper and allied products, chemicals and allied products, and mines and quarries sectors accounted for the majority of self-supplied industrial users with the capacity to withdraw more than 100,000 GPD (MDEQ, n.d. 3).
Irrigation use is fresh water applied by an irrigation system to assist in the growing of crops and pastures or to maintain vegetative growth on recreational lands such as golf courses. Golf course irrigators with the capacity to withdraw more than 100,000 GPD report withdrawals to the MDEQ. Agricultural irrigators with the capacity to withdraw more than 100,000 GPD may report to the Michigan Department of Agriculture (MDA) or to the MDEQ. For the report of 2004 water withdrawals, however, the MDEQ reported agricultural irrigation withdrawals estimated using a computer model rather than actual reported withdrawals. The model, developed by the MDEQ, the MDA and Michigan State University (MSU), uses county-level data from the U.S. Census of Agriculture for irrigated farms greater than 14 acres, and local weather and soils data (MDEQ, 2006).
Thermoelectric power generation use is self-supplied water withdrawn by fossil fuel and nuclear power plants primarily for cooling systems that dissipate waste heat produced in the power generation process. The MDEQ report of 2004 water withdrawals describes three types of cooling systems: open, closed and combination.
“An open cooling system, such as once-through cooling, withdraws water continuously from a natural water body, circulates the water through condensers in the plant once to remove waste heat, then discharges the water back into a receiving water body. A closed system, such as a cooling pond, cooling tower, or radiator heat exchanger,recycles the same cooling water more than once, requiring only periodic withdrawals to replace water losses. In some cases, a power plant may use a combination of cooling systems for the same generating unit” (MDEQ, n.d. 4).
The MDEQ does not collect or report information about domestic water use. Domestic use refers to fresh water withdrawals from private household wells for indoor and outdoor uses. Examples of indoor uses are drinking water, preparing food, bathing, washing clothes and flushing toilets. Major outdoor uses include watering lawns and gardens. Because domestic users are not required to report withdrawals in Michigan, the USGS uses data on public supply withdrawals and population to estimate domestic use for Michigan. The MDEQ reported that public water suppliers supported 7.2 million persons in 2004 (MDEQ, 2006). The remaining population (2.9 million persons1 ) is presumed to be served by private domestic wells. The USGS applies a per capita use coefficient of 86.3 gallons per capita per day2 to the domestic use population to estimate total water use by this sector.
In general, a water user withdrawing surface or ground water is not required to report withdrawals if withdrawal capacity is less than 100,000 GPD averaged over any consecutive 30-day period. This means that, besides domestic users, a number of other types of water uses in Michigan are not reported and, as a result, not included in Michigan’s annual water withdrawal summaries. For example, non-community public water supply systems (below the capacity threshold) are not required to report withdrawals. A non-community public water supply system provides water for drinking or household purposes to 25 or more persons at least 60 days per year or has 15 or more service connections.3 Examples include schools, restaurants, motels, campgrounds andchurches that have their own wells. Another category of water use that is not inventoried is withdrawals for livestock production that are below the capacity threshold. Unlike some states, Michigan does not report annual withdrawals by livestock production facilities. (However, the USGS estimates withdrawals for livestock production for its periodic report using estimated use coefficients.)
Water Withdrawals in Michigan
With one exception, the data provided in this section are from the Water Withdrawals for Major Water Uses in Michigan 2004 report (MDEQ, 2006) and associated user-specific reports (MDEQ, n.d. 1, n.d. 2, n.d. 3, n.d. 4). The exception is domestic water withdrawals. The domestic use numbers presented in this section are calculated according to the method described previously: an estimated domestic use population of 2.9 million is multiplied by a per capita use of 86.3 gallons per day. All withdrawals are fresh water from groundwater and surface water sources. Surface water sources include the Great Lakes and inland lakes and streams. A summary of water withdrawals by category of user and water source is shown in Table 2. This data is presented on a percentage of total basis in Figures 1 and 2.
Table 2. Water withdrawals by major user categories in Michigan, 2004, million gallons per day.
|
Type of use |
|
Water Source |
|
Total |
|
|
Great Lakes |
Inland Lakes and Streams |
Ground Water |
|
|
Public Supply |
879.2 |
17.8 |
247.3 |
1,144.3 |
|
Industrial |
426.6 |
113.0 |
89.1 |
628.7 |
|
Irrigation |
5.0 |
98.3 |
187.0 |
290.3 |
|
Thermoelectric power |
8,404.2 |
476.7 |
4.1 |
8,885.0 |
|
Domestic |
- |
- |
250.3 |
250.3 |
|
Total |
9,715.0 |
705.8 |
777.8 |
11,198.6 |
Source: Data reported in or calculated based on MDEG (2006).
Total water use in Michigan during 2004 was 11,198.6 MGD or almost 4.1 trillion total gallons for the year. Most of the water withdrawn (87 percent) was taken from the Great Lakes (Figure 1). The actual number of facilities withdrawing water directly from the Great Lakes is relatively small; most of the water taken from the Great Lakes is used by a few thermoelectric power plants. In fact, the single category of thermoelectric power users accounted for the largest percentage of total water withdrawn (almost 80 percent) in Michigan (Figure 2).
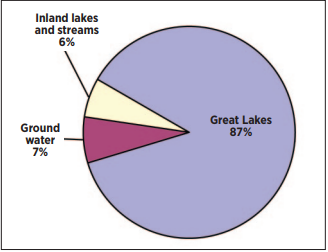
Figure 1. Total water withdrawals by source
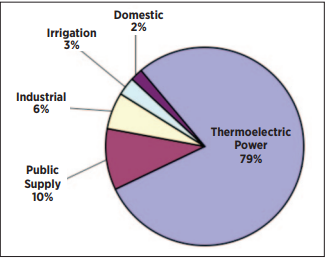
Figure 2. Total water withdrawals by major user
Total water withdrawn for public supply uses was 1,144.3 MGD (Table 2) or about 10.2 percent of total water withdrawn by all sectors. The primary source of water (almost 77 percent) for public supply was the Great Lakes, although Great Lakes water was withdrawn for public supply in only 34 of Michigan’s 83 counties. Ground water accounts for just less than 22 percent of withdrawals for public supply; the remaining 1.5 percent is from inland lakes and streams. The MDEQ reported that 1,437 community public water supply systems withdrew water to serve 7.2 million persons (more than 71 percent of Michigan’s population) in 2004.
In 2004, 380 self-supplied industrial facilities withdrew a total of 628.8 MGD, almost 6 percent of total water withdrawn in Michigan. The Great Lakes supplied almost 68 percent of the water withdrawn. Almost 18 percent came from inland lakes and streams (MDEQ, n.d. 3).
Of the total 290.3 MGD of water withdrawn for irrigation use in 2004, 88 percent was for agriculture. Irrigation water withdrawals were estimated based on the 452,800 irrigated acres and 1,568 irrigators in Michigan reported in the 2002 Census of Agriculture (MDEQ, n.d. 1). For 2004, 619 irrigated golf courses were registered in the Michigan Water Use Reporting Program (MDEQ, n.d. 2). Groundwater supplied most irrigation for both agriculture and golf courses (64 percent); inland lakes and streams provided almost 34 percent of irrigation water.
The MDEQ reported that 91 thermoelectric power plants were identified during initial registration with the Water Use Reporting Program (MDEQ, n.d. 4). Of these, 44 had the withdrawal capacity requiring them to report water use for 2004. Those 44 plants withdrew a total of 8,885 MGD, with the majority of water withdrawn from the Great Lakes (95 percent).
Based on the number of persons served by public watersupply facilities in 2004, approximately 2.9 million people – almost 29 percent of the population – relied upon private domestic wells. This category of users withdrew 250.3 MGD or about 2.2 percent of total water withdrawn by all major sectors. This represents about a five percent increase from the 2000 USGS estimate of 239 MGD withdrawn by domestic users (an estimated 2.8 million people relying upon private wells). In 2000, according to the USGS report, Michigan was second only to California in the number of residents relying upon private wells in the nation (Hutson et al., 2004)4.
Applying the median values of consumptive-use coefficients shown in Table 1 to total withdrawals, total consumptive use by sector was estimated for 2004 withdrawals (Table 3). While thermoelectric power accounted for the largest withdrawals, that sector has the smallest consumptive-use coefficient (2 percent) and thus, represents the second largest consumptive use. Total withdrawals for irrigation were only about three percent of thermoelectric withdrawals. However, irrigation has the highest consumptive-use coefficient (90 percent) and, as a result, is the sector that results in the largest total consumptive use.
Table 3. Total consumptive use by major user category, 2004, million gallons per day.
|
Type of use |
Total withdrawals |
Consumptive-use coefficient (percent) |
Total consumptive use |
|
Public supply |
1,144.2 |
12 |
137.3 |
|
Industrial |
628.8 |
10 |
62.9 |
|
Irrigation |
290.3 |
90 |
261.3 |
|
Thermoelectric power |
8,885.0 |
2 |
177.7 |
|
Domestic |
250.3 |
12 |
30.0 |
|
Total |
11,198.6 |
|
669.2 |
Data Collection and Estimation
Water withdrawals reported by Michigan may over- or under-estimate actual water use for a number of reasons. While some non-community water supply systems report withdrawals, those falling below the 100,000 GPD threshold are not required to report. Thus, much of the water used in schools, churches, restaurants, motels and campgrounds is not accounted for. Michigan has 11,000 non-community systems that serve 1.7 million people on a periodic basis (MDEQ, 2009). Withdrawals for livestock production, including aquaculture, are also not reported if they fall below the 100,000 GPD threshold. However, the USGS estimates withdrawals for livestock uses in Michigan at 84.9 million GPD for 2005 (Kenny et al., 2009).
Domestic withdrawals are also not reported, but domestic uses are estimated by the USGS using the approach described earlier. For several reasons, estimations of domestic withdrawals may be inaccurate. On the one hand, the study from which the per capita use coefficient was adapted measured water use primarily in metropolitan areas. Water use in areas where private domestic wells predominate may include more withdrawals for watering lawn and flower gardens, washing automobiles and filling swimming pools than are observed in metropolitan areas. In addition, many domestic wells supply water for livestock-related purposes in addition to indoor and outdoor household uses. Thus, estimates of domestic withdrawals are likely too low. On the other hand, this underestimation may be offset, at least in part, by the fact that the water-use study from which the per capitause coefficient was derived reported leakages in household plumbing for the sample used in the study of as much as 10 percent of water withdrawn; one cannot automatically assume that homeowners with private wells have plumbing that is as leaky as the public water supply users included in the study.
A lack of reliable data on the number of residential wells in Michigan and the number of people served by these wells further complicates estimating domestic withdrawals accurately. The 1990 Census of Population and Housing included information on the number of households relying upon private wells5 , but that data series was discontinued with the 2000 Census. The MDEQ collects data on the number of residents served by public water supplies, and the USGS subtracts that number from the state’s total population to estimate population served by domestic wells. But the number of residents served by public water supplies is based on the number of residential connections reported by public water systems multiplied by an estimate of persons per household. However, public suppliers often cannot determine with certainty how many of their customers are households and how many are other types of users, such as businesses. All of these issues increase the uncertainty in estimates of domestic withdrawals and in estimates of total water withdrawals.
Michigan, along with the other 49 states, reports water withdrawal data to the USGS every five years. The USGS adds estimates for categories of users not reported by the states and publishes its report every five years as part of the National Water Use Information Program. Established in 1950, the NWUIP is the only source of comprehensive water-use information at the national level that provides data for analysis on status and trends of water use throughout the U.S. (NRC, 2002). To the extent that withdrawals are neither reported by a state nor estimated by the USGS (as domestic withdrawals are), total water use reported by the NWUIP is subject to the same uncertainties and potential errors described above. While the NWUIP has established a standard procedure for states to use in reporting water use, wide variability exists among the states across user definitions, reporting requirements and estimation methods.
The Great Lakes−St. Lawrence River Basin Water Resources Compact requires Great Lakes states to gather and share information on water withdrawals. The Great Lakes–St. Lawrence River Basin Water Resources Council adopted a set of interim reporting protocols to help ensure that all Great Lakes states apply a common and consistent process for collecting water withdrawal information.6 The protocol specifies the water-use sectors for which withdrawal data will be reported and the information to be collected. Compliance with this Compactrelated activity would mean that withdrawals by more types of water users would be compiled and reported for Michigan, although only for those users withdrawing more than 100,000 GPD. However, whether or not the existing approaches used for measuring or estimating water withdrawals in Michigan will change is unclear.
References
Hutson, S.S., Barber, N.L., Kenny, J.F., Linsey, K.S., Lumia, D.S, & Maupin, M.A. (2004). Estimated use of water in the United States in 2000. (U.S. Geological Survey Circular 1268). Reston, VA: U.S. Geological Survey.
Kenny, J.F., Barber, N.L., Hutson, S.S., Linsey, K.S., Lovelace, J.K., & Maupin, M.A. (2009). Estimated use of water in the United States in 2005. (U.S. Geological Survey Circular 1344). Reston, VA: U.S. Geological Survey.
Mayer, P.W., DeOreo, W.B., Opitz, E.M., Kiefer, J.C., Davis, W.Y., Dziegielewski, B., & Nelson, J.O. (1999). Residential end uses of water. Denver, CO: American Water Works Association Research Foundation and American Water Works Association.
Michigan Department of Environmental Quality (MDEQ). (n.d. 1). 2004 estimated water withdrawals for agricultural irrigation in Michigan, by county. Retrieved from www.deq.state.mi.us/documents/deq-wd-wurpAgriculture2004.pdf
Michigan Department of Environmental Quality (MDEQ). (n.d. 2). 2004 water withdrawals for golf course irrigation in Michigan, by county. Retrieved from www. deq.state.mi.us/documents/deq-wd-wurp-Golf2004. pdf
Michigan Department of Environmental Quality (MDEQ). (n.d. 3). Water withdrawals for self-supplied industrial manufacturing in Michigan 2004. Retrieved from www.deq.state.mi.us/documents/deq-wd-wurpIndustrial04.pdf
Michigan Department of Environmental Quality (MDEQ). (n.d. 4). Water withdrawals for thermoelectric power generation in Michigan 2006. Retrieved from www. michigan.gov/documents/deq/deq-wb-wurpTEreport06_214956_7.pdf
Michigan Department of Environmental Quality (MDEQ). (2006). Water withdrawals for major water uses in Michigan 2004. Retrieved from www.deq.state.mi.us/ documents/deq-wd-wurp-report04.pdf
Michigan Department of Environmental Quality (MDEQ). (2009). Welcome to the noncommunity water supply site. Retrieved from www.michigan.gov/deq/0,1607,7- 135-3313_3675_3692-9395--,00.html
National Research Council (NRC) Committee on U.S. Geological Survey Water Resources Research. (2002). Estimating water use in the United States: A new paradigm for the National Water-Use Information Program. Washington, DC: National Academy Press.
Shaffer, K.H., & Runkle, D.L. (2007). Consumptive water-use coefficients for the Great Lakes Basin and climatically similar areas. (Scientific Investigations Report 2007–5197). Reston, VA: U.S. Geological Survey.
Solley, W.B., Pierce, R.R., & Perlman, H.A. (1998). Estimated use of water in the U.S. in 1995. (U.S. Geological Survey Circular 1200). Denver, CO: U.S. Geological Survey.
U.S. Census. (1990). 1990 census of population and housing. Retreived from www.census.gov/prod/ cen1990/cph5/cph-5.html
U.S. Census. (2009). National and state population estimates, annual population estimates 2000-2009. Retrieved from www.census.gov/popest/states/NSTann-est.html
U.S. Environmental Protection Agency (USEPA). (2009). Pipe leak detection technology development. Retrieved from www.epa.gov/awi/pdf/600f09019.pdf
About the Authors
Saichon Seedang was formerly a visiting assistant professor with the Guyer-Seevers Program in Natural Resource Conservation; Department of Community, Agriculture, Recreation and Resource Studies; Michigan State University and is now a senior research fellow, Institute of Water Policy, Lee Kuan Yew School of Public Policy; National University of Singapore.
Patricia E. Norris is the Guyer-Seevers Chair in Natural Resource Conservation; Department of Community, Agriculture, Recreation and Resource Studies; Michigan State University.
Acknowledgments
The authors would like to thank Andrew Lebaron (MDEQ), Carol Luukkonen (USGS) and Ruth KlineRobach (MSUE) for their review of this bulletin.
1 The most recent U.S. Census estimate of Michigan’s 2004 population, reported in 2008, was 10,090,280 (U.S. Census, 2009).
2 The per capita use coefficient of 86.3 gallons per capita per day is adapted from a 1999 study of publicly supplied residential use conducted by the American Water Works Association (Mayer et al., 1999, as cited by Luukkonen, personal communication, 2008).
3 www.michigan.gov/deq/0,1607,7-135-3313_3675_3692-9395--,00.html
4 In its estimates of water use in 2005, the USGS reports that Michigan’s 2.9 million people served by private wells surpass the number of people served by private wells in any other state, including California (Kenny et al., 2009).
5 The 1990 Census of Population and Housing reported that 1,121,066 housing units (including both occupied and vacant) received water from private wells. However, this does not mean that 1,121,066 private residential wells were used in 1990, since the Census included in this count those cases where up to four separate housing units were using the same well (U.S. Census, 1990).
6 The interim reporting protocols, adopted with Resolution #9 in December 2009, can be viewed at: www.glslcompactcouncil.org/ Resolutions.aspx