Envisioning the Evolving Role of Aerial Drones for Improved Crop Management & Environmental Protection on Farms
 Print
Print Email
EmailMarch 7, 2022
More InfoVideo Transcript
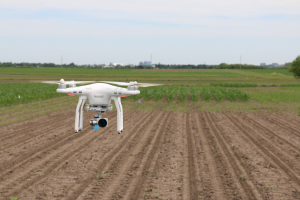
- Let me say my name's Lyndon Kelley. I work for MSU Extension. I'm working on this field crop sponsored webinar today. We have three sponsors today: GreenStone Farm Credit, North Central SARE Program, the Sustainable Agriculture Research Program, and Mark Wolbers with the Alaskan Pioneer Fruit Growers Association. Thank you to our sponsors. Next up is Dr. Bruno Basso. Bruno's gonna talk to us about sort of the what's the future of using aerial drones in pest management. Bruno's been around MSU talking about plant crops soils and sustainable agriculture, and has a real knack for looking into the future and technologies. I'll turn it over to you, Bruno. - Thank you, Lyndon. And I would like to thank the organizers for inviting me to share with you all some thoughts about long-term sustainability. I also wanna say that I have truly enjoyed Scott's seminar this morning. I always do. And I will be bringing a little bit of a different angle from his incredibly interesting presentation. But again, even though the focus is about imagery and integration of system, you have to understand that the ultimate goal is trying to push for sustainable agricultural systems. And more recently, both in the research domain or in general, even in farmers, there's this concept of one health. So, we need to be able to deal with healthy environment in order to have healthy foods and healthy communities. So, the healthy ecosystem that we work with, whether it is through more advanced machinery or through the technology that I work on could possibly lead to better food systems and food in general from both not just the quantity, but also the quality. So, more nutritional components of the food system. Together, if you manage your resources correctly, you end up doing well better in terms of healthy farmers from a profitability standpoint, as well as we know how risky being a farmer is and how much of the thin line and margin that they have leading to sometimes pretty serious concern about the whole enterprise and their own wellbeing from a mental standpoint, facing complexity affecting the decisions both on the family side, looking after the land at the same time. And if all these three things are connected, we're also witnessing a much more greater transparency from the consumers. And so, we also would like to see this integrator better with this healthy community coming together. No need to add anything after Scott's talk about how the technology's moving, but I do wanna bring that this integration is really part of a system and there isn't one size fits all. There isn't one solution. Everything has to come into place. And so, I work really on how this integration of systems come together. One thing in general for users, I think we should never forget the breakthroughs that we have seen in agriculture before. So, very clearly beginning of the century, thanks to the mechanization, we were able to be able to cultivate a much larger extent of land, and which brought a significant positive aspect in terms of greater yields, but at the same time, we weren't ready for the environmental impact of what an extensive mechanization would do with the dust bowl. And following that, we're still living some of the consequences with the dilemma between till, no-till to be able to retain the soil surface and reduce erosion and so on. In the '50s, we had the advantage of the chemistry. So, fertilizer and agrochemicals in general that allowed us to really be able to protect the plants better. And it was right between the beginning of the fertilizer with the overbotch and the agrochemicals that one major event occurred in agriculture, which is the green revolution, and which was again, genetics, new cultivators responsive two fertilizer. So, instead of having tall stems of wheat that were short cultivar responsive to fertilizer, and that event led to a significant amount of yield increase, especially in places like India, that led to Dr. Borlaug, the Nobel Peace Prize in the '70, because of the amount of people that were saved because of the genetic improvements as a result of combination with agronomy improvement. Then we all know we moved into biotechnology. We're still very much into it. Now first we genetically modify transgenic CRISPR technologies. But more recently what you have seen already, the data science and then basically, robotic satellites, big data sensors, and the omic sciences, but there is some thing else coming that I would envision to be important. And it's, again, how we can better predict these things coming together. So, what we in engineering terms, it could be often used as a digital print. So, can we reproduce the effects on the computer? Can we generate to avoid errors, the simulation of the system? So, by definition, a digital twin for more than agriculture, is truly a bridge that links between the physical and the digital world to promote an innovation performance. So, I have worked very much into modeling agricultural systems, and so be able to grow plants on a computer. And we have done significantly good job. Continue to obviously needing improvements for various reasons, sometimes complexity in fully understanding and capturing the process that we simulate. But mostly, it's also be able to capture input that describe the system correctly. So, instead of using a weather station far away, we have a possibility to improve now the possibility of using more of a localized weather. So, obviously, using something not fully descriptive of the system will also lead to potential error. And so, digital twin is again, is this virtual model of a process, product, or service that it's pairing the virtual with the physical world. And both link into that biology system approach, like I mentioned, crop simulation models to fully design this next agriculture revolution. And as you can, well, see, I mean, all these robotics, and they are based on digital twins. They don't get implemented until they're fully simulated on a computer to see all the effects using AI and engineering technologies. So, but I bring the digital world from a biological point of view because I would say the complexity is present throughout, but dealing with biology may have a one level of complexity, even greater than an engineer system being man-made, designed by the men versus biology being affected by complex interactions. Like one that you see here, you have climate variabilities, the norm, rather than the exception. You got climate changing from one place to another within the same field, often depending on some of the variables, the salt temperature, for sure, depending on positioning the landscape or salt texture, again, topography management, if it's done correctly, like the Scott showed. An implementation of the, I mean, an intervention of a tillage system, or going into the field has a very strong component in increasing variability because of the responses of that damage will vary from one place to another, depending on, again, the amount of water stored, and the soil texture and so on. So, uniformity of plants and the number of plants that emerge, the uniformity in the emergence time is critical. New genetics is important versus you gotta capture that versus all traits and what you use trying to detect the effects on the final yields. And then all integrated into how much variability there is from one year to the next, yield stability, as you'll see a little bit. So, we are able to reproduce fields in 3D form. This is a digital image from a high-resolution UAV at one-centimeter resolution on the ground. And the MyLab uses all kinds of technology. So, just focusing for few minutes on the type of remotely sense imagery. So, you have a UAV or drones and special resolution, depending on the resampling, can go from five to seven centimeters. So, a few inches versus an airplane. We have a pretty strong connection with airborne imagery companies. And they provide imagery ranging from one meter to two meters on the ground. And we also use, I've been working closely with this satellite company, this tubes satellite SkySat owned by Planet, and three-meter resolution on the ground. And all this depend. The spacial doesn't tell the whole story. You have to understand the temporal resolution. And so, in a UAV system, obviously you're dependent on when the pilot can go. It's certainly weather dependent, but much less than other system. And airborne, we have imagery every couple of weeks for total, between 10 and 13 images per season. Planet is daily, if there are no clouds. But the fact that it's daily, you can still capture pretty well, unless you are really in a location where clouds dominate. And unfortunately, as often happens in the Upper Midwest. So, sensors, you could use multispectral. So, the electromagnetic spectrum is composed by the visible band, as well as the near infrared, what we call the visible band, red, green, blue. Then thermal imagery detecting temperature of the canopy, or we have LiDAR mounted on the system. So, we measure plant height or some indication of the phenology. Airborne, RGB, again, visible reflectance multispectral and thermal imagery. And Planet, we use visible and a combination of vegetation in the system. So, each of the system will have advantages and disadvantages, as you can see. The drone will provide the highest resolution, but is it that really needed in the terms of the farmer making a decision, or will it still need to be integrated across the large areas? Because the decision of the, the implementation of the management is still depended on the machinery that is used. Now, the frequency and field scale, with airborne, you can fly many, many more fields. So, if you have a large enterprise, you get the imagery collected high quality pretty much all at once. The satellite obviously brings the complete advantage of being you get an immediate very large scale, the frequencies important and high resolution. So, there is quite a bit of investment in that field and some good use coming on the satellite component. These advantages for the drones, obviously cost time consuming to geo reference. To stitch the images, you need to take several images together in order sometimes, or over few hundreds, just to get one single few acre fields, to be able to have a proper overlap and make look like one image. The airborne imagery, you have to sign up with this company. It could be a little bit more expensive. But with regards to Planet, you have the cloud issue. And this is still extremely important to understand that imagery is a critical. It's your eye in the sky. It really detects anything that happens in the field, whether it's done properly or not, with the best instrumentation or not, plants will always tell you the truth somehow. Are the integrators. And so, you can detect a healthy plant from a stressed plant, and you can measure like what we do with the LiDAR measures the plant height, and be able to understand differences within the field and start bringing all the system connections and feedback together. So, this is the type, and it is an example of one of the plots that we have at the long-term ecological sites. And you can see the large spatial variability that even across a small site, but you have an RGB image, the one on the left, you have a red edge, which is basically the slope of the curve going from the red to the near infrared. Very informative of about nitrogen uptake and chlorophyl. And it is important to the limitation of, I mean, the red edge is very important, but you still have to be able to understand the biomass such that you understand how much chlorophyl is, whether it's concentrated or diluted across a bigger or smaller biomass. NDVI is more of an integrated of canopy cover, not necessarily informative necessarily about strictly nitrogen, because it just detects the vigor and the size of the plant. And then thermal imagery, very useful to detect, again, temperature. And we actually say, does your field run a fever? You'll see in a minute, some of the special extent of this application. And then LiDAR, again, high volume in canopy that we've been using, not just in raw crop agriculture, but we're expanding more significantly in the specialty crops from getting quite a bit of insights, both in the grapes and orchards, both apples and cherries. Again, how does the spatial variability change? You'll see the UAV four centimeters, 20 centimeters, Planet three meters. Sentinel, which is a free European satellite 10 meters. And so, you see the changes in the sizes in the type of pixel or lens set. The NASA satellite that for one field you will have, you completely ignore all the variability within it. And you have one, just one single value of reflectance for the entire 30-by-30 meter. So, one piece of information that as you have seen, and also Scott confirmed, this is pretty much a default now. You got machinery coming with it. There is quite a bit of an extensive use. More recently, we saw that 68% of the US corn was harvested with combined and 45% of the corn was yield mapped. So, the issue is that when a farmer sees this in isolation, and is often done, whether it's not a good history of keeping the images or the complexity of dealing with the data, but it is very difficult for a farmer to implement an immediate viable rate application just based on the different uptake and the use. So, more recently, we've been using this concept that's been around for a while, yield stability trying to compare how each single pixel is different from the neighbor and how is it different. Over time to conclude that you have areas within the field, that they're constantly performing better. You have high-yielding, then you have medium-yielding. But low and stable, there are areas that they can constantly produce significantly lower than the middle in the field, or the unstable zones that they fluctuate from one year to the next. Now, we've been doing one of an expensive work here to scale it. And so, we've been using satellite imagery and a very large amount of yield data, yield mapping that we had available to be able to test this procedure using satellite imagery. So, this is an example. There are about 1000 images in this photo. And you'll see flipping it, there is very little that we can't detect anymore across the fields to understand the level of variation and why is it happening. Whether you bring an AI component, which we heavily use, or you simulate the system from a process-based model, which is actually a combination of the two integration of both of AI and process-based model to see what's driving variation. And this is for three years, but you can go back in time and again, calculate what's driving those changes. So, more recently we've been using thermal imagery and on this 3D field. And we, again, with the question as your field runs a fever, you could tell that the areas in blue, what we call cold and stable, are the ones that they've shown to have always a cooler temperature. Cooler temperature of a corn crop doesn't mean cold. It means basically they're cooler than the rest of the field. That they've been able to satisfy the evaporative demand. And so, it's a proxy for the able-to healthy plans. And you can see that matches well the yield stability map, or be able to have deep soil is on a flat areas, compared to the other hot and stable, where they basically have this shallow soil profile running out of water, and basically not having enough water to even take nutrients uptake and so on. So, it has been really good combination by linking this fusion of sensors with this concept and be able to develop this plant health stability concept, which is again, we don't have to be on any of these fields. And it's a very scalable technology. As I did few years ago, when nowadays you can basically understand the yield stability across any single field of corn and soybean field, where again, the partitioning between stable high yields, the stable low yields and unstable this present, we learned, and again, there's a paper, very detailed description of every single state, county, and sub-areas and so, but we learned that 48% of the within field is constantly performing well, leading to a nitrogen use efficiency of about 75%. It can never really be. I mean, there are parts where it was close to 90 or so, but we deal with a leaky system in agriculture. So, nitrogen leaching can only be reduced, but never really completely stopped. 25% of the fields are stable, low productivity. So they're basically constantly underperforming with a 45% nitrogen use efficiency. So, that's really a strong impact in terms of losses of resources, whether it's fertilizer, like the integration of the old areas. This is over about 70. We extended later to 80 million acres of the corn-soybean belt. And so, it's 1.5 kilograms of nitrogen going to the Mississippi River. Over $ 700 million of unused fertilizer, the equivalent of that, and 1 billion giga jewel of energy lost in addition to millions of tons of CO2 sent back into the atmosphere. Now, with this scalable work, we have also learned for any of this field in 3D visualization tools, we can understand the vulnerability, and it's the more prone to be water deficit versus water access. So, which are the basis to drive any level of prescription ahead of time, and to scale prescription. Because every single field has a different story to tell. And so, the possibility of understanding, the factors affecting one field, it's a critical advances in this type of agronomic settings. Now, just to show you where we know exactly where these low end stables are. And the interesting thing is we also know where they are located, how contiguous they are, if there is one small piece or it's large-enough areas that something else could be done. And so, managing these 0.3 million acres of low productivity. And when I say low productivity, obviously it doesn't mean no production, but it means yields of 120, 130 bushels. And you know with the prices, I guess before going into the crazy values of very expensive fertilizer or now even greater corn prices, but in general, using what we know as a price, is that this, you need 170 bushels to break in. And so, there is a quite a bit of loss from a profitability standpoint, in addition to natural leaking greenhouse gas emissions. And so, bringing the sustainability into place, you know now that these big companies, the CPGs, consumer package goods, or they impose whether it's potato systems, as we will not buy, Walmart will not buy potatoes produced with as strong footprint of carbon or water footprint, leaving very much this up to the farmers. And so, it's kind of our role to bring the sustainability and helping them be making better decision by integrating all these pieces together. So, profitability, if you think of a single yield map and you simply convert, do an analysis, we have the exact prices of everything included here. And so, you'll see that there's quite a bit of areas. And there are quite a bit of areas where there are losses, economic losses. But when you bring the 11 years and you bring this yield stability analysis and the mesh net, this is just a different way of showing what is the predominant conditions underneath. So, when you see green underneath, it is unstable, but was mostly medium yield. But after extracting seven years of corn, you'll see that the profitability is pretty, I mean, the losses are pretty high in the ranges of even $200 an acre. You will say how that is possible. As you know, farmers can lock in prices ahead of time and there's insurance that allows them to maintain the level of business that they're facing. So, one of the concepts that I'm basically working on, I have several grains from the NRCS or the Farm Service FSA, USDA, and NIFA, is this precision conservation, the possibility of using profitability maps and decide where to focus on the variable rate areas where we know there is a response, historical response, because the point here is, is if you have seen through the yield maps that these area says not, despite the fact that you have a uniform application of fertilizer, whatever rate you have been using, let's say even in the 180 and you still get 120, 180 pounds per acre, but you still get 130, 140 bushels, well, that nitrogen was not the variable affecting. And so, be able to concentrate, push the envelope in areas where there is a response and be able to introduce this alternative way of possibly incentivizing, bringing sustainability through different measure either by using native vegetation, pollinators, and removing this unproductive land, or at least now put the same amount of fertilizer like he variable rate, you don't have to convert necessarily to native pollinators to bring. But that level of investment will still be returned possibly by some sustainability measures that your field or your farm has a certain percent of biodiversity within the farm. So, that's a totally different view that currently farmers do not see, but it's certainly coming. And the reason it's coming much, much more is because sustainable investment, ethical finance, and these companies have a story to tell to someone else. And so, in the end, farmers are faced with this very complex decision. And I think it's our role as a scientist to be able to bring this sustainability and environmental profit sustainability into the discussion. Now, that's an example of modeling native plants on marginal lens to see how much carbon can be stored as a result of potentially sell it on the future carbon markets, because you'd be accumulating carbon non-heading greenhouse gas emissions from other fertilizer because you won't be adding fertilizer on native plans and so on. So, this is an example that we distribute to several farmers that we have incentivized the adoption of bio. We call it biodiversity conservation areas. And so, that's based on profitability analysis with the cost that they provided or some of general cost and they can adjust. But even the sizes can be adjusted. But it has been really rewarding to see a lot of this coming together. And so, that particular project has a variable rate the way I describe it as well, DCA on the same field. So, this is another project that I wanted to share with you, but by asking the question, what's happening on this low and stable zones? Are they proxies for any indication about carbon storage? And what's the story on carbon on the low? And so, basically the solar organic carbon is constantly out of these 240 samples that we took on this transit. That amount of carbon stored on the low and stable zone is significantly lower than the medium, stable, and the high and stable zones. We also did this kind of new test that brings both the overall soil health a step beyond, I think, some of the existing soil health indicators, because it separates the overall health from health and fertility, and includes where you are located. The climatic zones, the rainfall, the soil orders. And so, we compared that the low and stable zones constantly at quite a bit of the lower scoring of soil health versus the high and stable zones. Preaching again for certainly more tailor and customized variable rate application, understanding this spatial variability. So, one of the things that we do over the years, I have developed this model called SALUS, the System Approach for Land Use Sustainability. It's an evolution of a previous existed models series, which is a model, one of the first basically process-based model pioneered by my former supervisor, Joe Ritchie. Actually, Joe was put in charge of leading the effort of building the SALUS model as an investment from the Central Intelligence of the US, fortunately, to predict how much wheat was produced in Russia during the Cold War because statistical models obviously were able to capture changes occurring both in management and weather conditions. So, this is an example. The map shows where the model has been tested with scientific journals and paper reporting. So, the good and the bad, but it's pretty impressive to see the extent. So, this models have been around. And they capture the integration between the soil plant atmosphere system, including management. And so, I added a significant advancement in management components, the soil biochemical routines for soil carbon credits, the soil phosphorus, and again, the impact of tillages and so on. So, we use, just to give you a very quick analysis on how variable rate is, the rates are decided based on the mineralization and the position in the landscape. And so, we partition from the scalable technology. We have zones divided in high and stable, medium and stable, unstable depression, and unstable hilltops, for which I've shown you about, the possibility of accumulating water or ran out of water, depending on where you are. So, a farmer would use in this particular case of you run the model of, with a suite, this is a very short cut of the infinite runs of weather and soil integration. I mean, runs that we do. So, from a farmers will continue to put, this is basically the average. But realistically, you can see that the response for that particular year stops at about 95 instead of what farmers will currently put. So, we deliver prescription this year. We send prescription to about 5,000 acres. Well, farmers and collaborators. And it's a turnkey solution. So, basically they just receive it, they put it on their machinery. And this is an example of 67 fields in Michigan, where nitrogen use efficiency was a significantly improved and reduction of fertilizer. As you well know, it's very difficult to monetize the environment. That monetization of the environment never comes into discussions on any level of discussion in agriculture. And so, this is a way of what the companies would like to see. And we could potentially help in that. You may not be able to increase yields in many of these areas, but you can certainly increase profitability by putting less input and reducing the environmental impact. So, one other way that I'm using and using this technology, I would say, I guess in a novel way, is to convert the as-applied map into carbon credits, because that has not been, I'm working on basically making this part of a protocol for credits. And so, nitrogen saving from precision agriculture from precision conservation could be the key in the future, because when you upload the as-applied map, that could be potentially a check for a farmer that has for the first time, as a reference compared to the high and stable zones, that the amount nitrogen that is really being reduced. And so, you see here, you'd go total nitrogen applied, you have 50 kilograms or pounds per acre similar, you see here, you put 50. In the areas where you need it, you have 160. But so, here you saved nothing. You saved zero. But in the areas where you didn't put as much as 110, and that gets converted into 340 kilograms of CO2 or equivalent corrector. But if you were not even to plant and not put any, even the minimum amount that you put on the side, on the edges, on the low end stable zones, and you put native vegetation, so basically not put any fertilizer at all, then the amount of credits will even increase. So, we scale this technology from asking question of whether, what if I move from a conventional tillage to a no-till and I plant cover crop, how much carbon does the humic form? That's the slow organic pool. How much will I know how much nitrate leaching? And that's a distribution of the yield mapping for several years, up to 12, 13 years of historical yield maps and validation that we have. And so, as a disclaimer, all this technology was acquired. I co-founded this company called CIBO Technologies. And this makes the stability maps available for free for farmers. So, you can visit CIBOTechnologies.com. The goal of CIBO is to enroll farmers to evaluate them the what-if scenarios, and be able to help them work with CPGs companies. So, it isn't necessarily a business model that a farmer has to pay, rather, the one that has quite a bit more money will benefit from it. So, you can click on any single parcel or fields across the US, and you get the stability map that I've just shown. You get a profitability productivity score, you get a yield prediction. I'm not doing that as an advertisement because you, again, you can go there and see it for free, but it's the way this technology is coming together. Everybody has things to show off, but the agronomy seems to always lag behind. And I think that's really not necessarily longer the case. There's quite a bit of integration of a system approach, bringing the potential for regenerative potentials and be able to quantify greenhouse gas emissions coming from a field or how much nitrogen leaching is lost and be able to use that information. To bring more transparency, you get even a knowledge of how much the land should be rented for, or what is the real value of purchasing that land? So, the business model is quite different than targeting at getting money out of the farmers. Recently, I worked on these two papers, one in the Proceedings of the National Academy of Sciences and System, where I know this is quite a bit of information, but if you look at the map on the left, that's pretty much current agriculture. You have basically energy-intensive grain storage, where it's not efficiently harvested. Farmers don't necessarily start with a criteria of new minimizing energy storage. Fertilizer are applied off season before the crop can even use it. They say for simplicity, or be able to go in the field, but also there's an economic. But anyway, there are, you can see the values there. There is lots of spatial variability. And despite the fact that fertilizer is still applying in areas, the low and stable areas where it shouldn't be applied. And you have poor soil health. You have the issues with the confined animal facility operation that distribute manure only within a very short radius and ponding conditions. And you can read all of that as much as I do. But just to move towards the right is we have now a possibility of using tools completely free available for farmers to design when and where to harvest, which fields to minimize the energy. You could generate energy. There's a recent paper that we published with Lisa Schulte and others on nature sustainability, on energy production on the farm, that it can still be managed between food and energy production with the off season use of biomass for storage. I mean, to create biodigestion and biogas. Biomass and pollinators accumulating carbon, potentially use some of these low-productivity areas, edge of fields, and with some of the solar panels, microbial fertilizer, to be able to reduce the greenhouse gas emissions and new traits to be able to have more carbon allocated to roots and be able to keep the roots in the soil. And so, depending on the technology readiness level, you can go from the zero currently available with the colors in white, mid-term more in gray, and long-term at the end. And so, eventually trying to lead. This is again, still very much into the science, but it's coming together to see if this solution would eventually arrive at the farmer if profitable, such that we'll lead to a circular. This new kind of terminology, circular, bio economy trying to capture resources and recycle because that's what some of the companies are imposing to farmers. So, with that, I stop, and would like to thank obviously the members of my lab, students in postdoc, and the funding urgency that make my research possible. So, with that, I stop. And I thank you very much indeed for your attention. - [Eric] Right. Great. Thank you, Bruno. I've got just a couple questions so far. Everyone feel free to put all of your questions into the Q&A. Now we've got plenty of time for questions for Bruno. One question, has this technology, this variation, some kind of variation of it been applied to deciduous trees, small or large tracks looking for a disease. This person is particularly interested in Oak wilt. - Yeah, that's a very good question. As I mentioned, we are just briefly getting into this application of both UAVs and trying to understand, or actually even roots dynamics with electrical resistivity tomography. So, trying to bring soil and canopy together. So, personally, I have not worked on that. I have seen companies coming up. There is one per one called INBiosciences. And their goal is really to be able to protect trees from diseases. And they use a digital technology. I've helped putting together some of the thoughts. But there is lots of potential to be able to use reflectance from trees and artificial intelligence to able to see how this disease basically look like. Unfortunately, it is a little bit not a sector that I work on, but the technology is certainly applicable to precision or horticulture as it is happening. But it's an interesting question. And I won't be surprised if some of the forester may be able to have an answer on that. But remote sensing is certainly the way to detect diseases. There is a promising technology in there. - [Eric] Great. Another question. So, earlier in your presentation, you had a slide up that sort of compared UAV or plane and satellite. I have seen, or I've heard people talking about satellites systems that could get down to that one centimeter. How accurate is that? Is that ploy? Can you speak to that at all? - No, I don't think that's right, that level from satellite. I mean, you have the military that can go there, but not for civilian use. You can have panchromatic and resample images, but you can go at 50 centimeters is the highest resolution that I'm aware of for public use of imagery from satellite. And Planet is this incredible integrators because three meters actually, SkySat could go even and lower, but it's still in the range of a meter or so. The problem is that that level of spatial variability has to still be integrated into much larger zones type of approach, as I was trying to lead, because of the sizes, talking for row crops agriculture because of the sizes. Now I know that potentially you can spray every single row almost independently. But the technology is going in that direction. So, I don't know if increasing the spatial resolution at sub-meter is needed from satellite. In terms of trees, yes, that would be beneficial, but the way you wanna use satellite is to scale the technology. And so, it's much more a bigger question because you can always fly a drone. You can have an airborne imagery to fly over your orchards and get very detailed level of imagery. So, the use of satellite, it's only when you want to cover a much larger, spatial extent. - [Eric] Okay. All right. Again, we still have plenty of time for questions. So, if anyone has, no question is off the radar at this point. If you've got something for Dr. Basso, please go ahead and put that into the Q&A. And by the way, I'm not Lyndon Kelley. I had to join late. My name is Eric Anderson, a Field Crops Educator with MSU, also down with Lyndon in the Southwest part of the state, but I'll be moderating or helping to moderate the rest of the day. Bruno, have you looked or used SAR. - I beg your pardon? - [Eric] The acronym is SAR. - SAR that goes into some centimeters? - [Eric] Yeah. So, Amanda, if you could just clarify exactly what you mean by SAR, that might help a little bit. - SAR, I don't know. - [Eric] Synthetic aperture radar. - Yeah. Yeah, okay. Yeah. That's a totally different level of sensing. It's a radar. So, I wasn't necessarily aware that you can go at that level, but it's like what we use, LiDAR. It's pass. It's basically an active, you send a signal and the signal re-bounces back, counting objects. And so, it's designed to quantify the sizes of an object. And so, the 3D reconstruction plants. But all the, I mean, US, I've used red sands, but the spatial resolution is actually 10 meters. So, it's quite large. SentinelOne is a SAR. And we have used those, but they are in very large spatial pixel size. - [Eric] Okay. We don't have any more questions in the Q&A. I guess we'll give it another few seconds. So, if you got something halfway through the Q&A. - Okay. Scott left, I suppose, but he had no time for question himself, but- - [Eric] Right. Yep, Scott's off now. So, we've got Bruno's email address in the chat. - I'll be happy in case you have questions later. - [Eric] And you can always feel free to shoot Lyndon or I and email and we can either get in contact with one of the speakers, if needed, or get your questions answered. So, Bruno, thank you for very much, for coming on today. - You're very welcome. Thank you. - [Eric] I think what we're gonna do, folks, is we're gonna try to stick to the schedule, in case some people may want to just pop on and view just some of the presenters. So, instead of just going to our next presenter, we'll go ahead and take a little bit of a break. I just wanna clarify for everyone, Lyndon made this announcement. I'll just back him up. So, for those of you who will be looking for RUP or CCA credits today, the way those were applied for is all or nothing. So, if you wanted to pick up those RUP credits, we'll handle all that at the end of the day. But if you are wanting to be eligible for those, you have to be on for the whole time. So, if the other thing I'll mention, and maybe this was already mentioned before I came on, but just for how we're able to do our verification, if let's just say you and someone else sitting next to you are on and you both, you're gonna be looking for credits, we actually have to have an accounting in our Zoom log or attendance log for everyone who will be requesting these credits. So, if you are sitting next to someone, you're both gonna be requesting credits, we just need you to both get on, to hit that link that you used this morning and get on so that we've got a record of both of you. And that'll be through for all of the sessions throughout this MI Ag Ideas monthly or some. All right. And again, if you've got any questions for us, feel free to just put those in the Q&A and we'll answer those in the background as well. All right, everyone. So, we'll take a little bit of a break. Let's meet back here at about 11:05. - [Attendee] There's actually one question typed into the chat, if you wanna take one more question before you go to a break. - [Eric] Oh, here we go. Actually, Lyndon has a question. Bruno, what's the potential for using ground-penetrating radar from a drone to estimate soil moisture? - Yeah, that's a good point. I haven't, again, the only experience that I've had with ground-penetrating radar is from the ground. So, basically, machinery you can mount a GPR behind a tractor and be able to establish mapping technologies. The geologists that used this type of technology, but it's a little bit outside my expertise to know what are the potential, how deep can they go? Not having a direct contact. GPR is useful to be able to get this proxy for compaction and bulk density changes. And so, there is quite a bit of connection in the system, the amount of water going through and water availability to plants in relation to understanding compactions. But I have not being exposed to the use of drones for GPR. So, I won't be able to say much more, even though I'm fully supportive of GPR use. And currently, again, the technology's available when mounted behind tractors. - [Eric] Just got a comment from someone about the ground-penetrating radar. So far, only in the top five centimeters. - Yeah. - [Eric] And there's a publication here. It's from McNairn. And I'll post this for everyone to see, but there's a publication specifically talking about the use of those satellites. - Sounds good. Thank you.