Video on how to use the fruit growth rate model for apple thinning
 Print
Print Email
EmailThis video will walk you through taking measurements and using the model in the Malusim app.
Information and resources available to guide thinning decisions for apples have come a long way in the past few years. Models are available to help take some of the guess work out of this process. The Michigan State University Extension fruit team created a video to demonstrate how to use one of these tools.
The Apple Carbohydrate Thinning Model is used to adjust thinning rates each day based on weather conditions, which is available on the Enviroweather website, the Network for Environmental Weather Applications (NEWA) and the Malusim app. In addition, the Fruit Growth Rate Model can be used to determine whether make additional thinning applications. This model is also available on the Malusim app. Further instructions for both of these models can be found in this presentation Introducing the Malusim app.
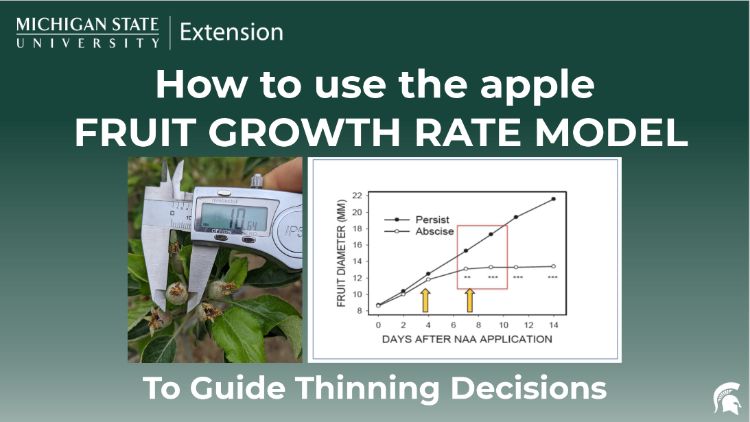
This video demonstrates how to use the Fruit Growth Rate Model for Apple Thinning. The video is available in Fruit Team channel of the MSU Kaltura MediaSpace Website, along with other videos created by the team for commercial fruit producers.
The video walks though how to use the model, from selecting trees and flagging spurs to measuring fruitlets and entering data into the Malusim App.
The Fruitlet Growth Rate Model
- Used to assess how much fruitlets are growing.
- Predicts which fruitlets will persist or abscise.
- Helps determine whether another thinning application is needed.
It may be especially helpful in years in which:
- Variable fruit set, when it is hard to make generalizations for thinning and information is needed for specific blocks.
- Frost damage, in which buds or blossoms may have some undetected damage and there are many missing kings.
- A prolonged bloom period, resulting in a range of fruitlet sizes at a given time.
- Poor or uncertain pollination, resulting in uneven fertilization.
All of these make it difficult to see and predict which fruitlets will set.
Things you will need:
- Apple Growth Rate Model
- Digital calipers
- Flagging tape
- Sharpie marker
- Pencil and paper/notebook
- Clipboard
Getting started:
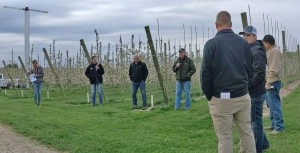
- Select a mature orchard block to tag trees. This should be done during pink to petal fall.
- Select five trees representative of the block. Choose trees distributed throughout.
- Count flower clusters on each of the trees. Do NOT count axillary buds on 1-year-old wood.
- Tag 15 spurs per tree. Make sure they are distributed similarly to the bud load (if more fruit is in the top, flag more spurs there).
- You do NOT need to label the fruitlets.
- Don’t use terminal buds or axillary buds on one year old wood.
Then you are ready to collect data and start using the Fruit Growth Model in Malusim:
- Visit the Malusim website.
- Watch the video to learn how to enter data and interpret results.
You can find more information and instructions for using Malusim in this presentation and in this PDF document on Precision Chemical Thinning for 2021 from Cornell University.