Why many growers are quick to adopt genetic modification technology
The economic savings associated with genetically modified crops makes them highly desirable to many agricultural producers, especially with today’s low farm prices. They also help produce a higher quality product.

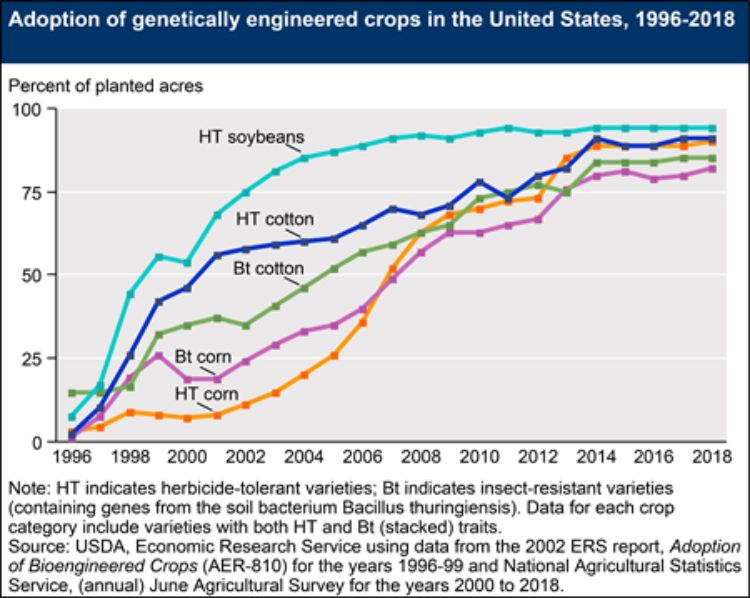
Genetically modified (GM) crops are produced using new genetic engineering methods. Since their development slightly over 20 years ago, they have become a significant portion of several high acreage crops in the U.S. (Fig. 1 and Table 1) and other countries. Once developed and approved for commercial production, many producers quickly implemented them. Why is that? What is it about GM crops that most producers find attractive?
The first answer for most is cost savings and ease of production. With U.S prices for most agricultural products steadily declining and grower costs steadily increasing, agricultural producers are always looking for production practices and technologies to help reduce costs. This includes new production techniques, higher yielding varieties and practices allowing them to reduce their expenditures, including pesticides and herbicides—this is what most GM crops do.
Most U.S. food items are not considered GM; however, all domesticated plants are technically genetically altered in the sense that they were generated using traditional breeding methods and contain a mixture of parental genes. Table 1 lists crops having some GM varieties approved for U.S. production. Additional GM crops are approved in other countries and more are in development for use worldwide.
|
Table 1. Genetically modified crops currently approved for U.S. production and the year released for commercial use. |
|
|---|---|
|
Crop |
Year released |
|
Soybean |
1995 |
|
Squash |
1995 |
|
Corn (Field) |
1996 |
|
Cotton |
1996 |
|
Papaya |
1997 |
|
Canola |
1999 |
|
Alfalfa |
2006 |
|
Sugar Beets |
2006 |
|
Corn (Sweet) |
2011 |
|
Potato |
2016 |
|
Apple |
2017 |

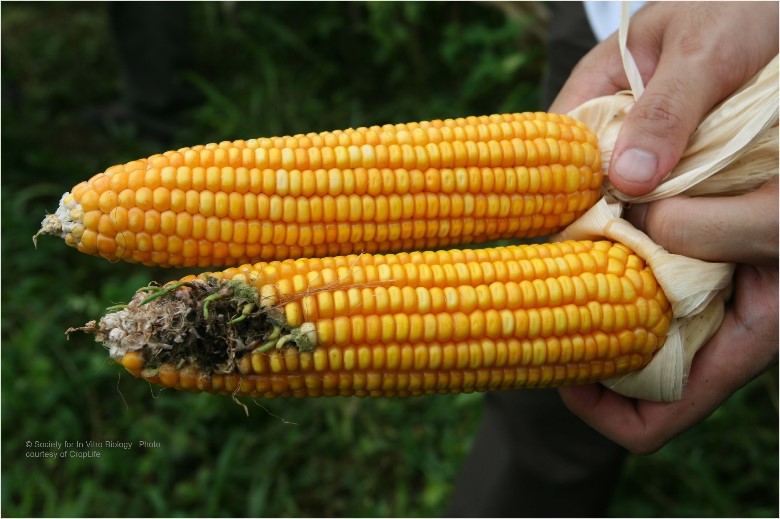
A 2018 article in Nature Scientific Reports is a review of the combined findings of 6,000 scientific articles from over a 21-year period. The authors report GM corn increased yield up to 10 percent, primarily due to a 60 percent reduction in loss due to insect damage. Furthermore, increased insect feeding leads to increased mold growth, which in turn leads to cancer causing mycotoxin production. Corn containing the Bt gene is protected from insect feeding and, therefore, has increased yield, increased ear and kernel quality (Fig. 2), and a 29 percent reduction in mycotoxins. They also found no significant effects to non-target organisms. It is possible to find references indicating GM crops do not increase yield, but this report is the most inclusive to date of the available science-based literature.
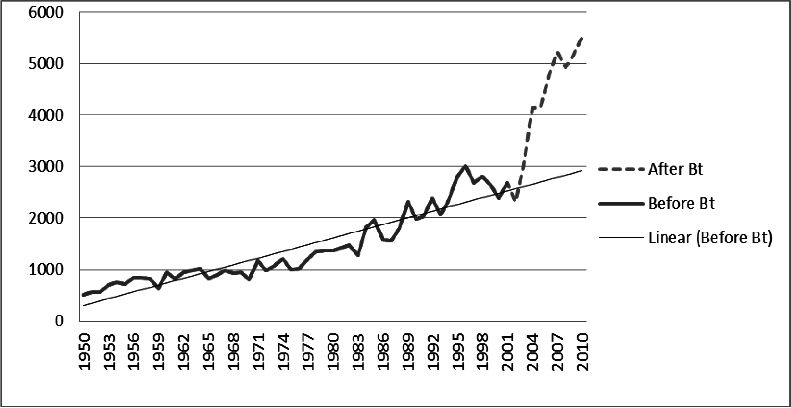
Given the chance to produce a higher quality product with a 10 percent yield increase without additional costs, it is easy to see why farmers would choose GM corn. This is not only true for corn in the U.S., but in other countries and for other crops. Figure 3 shows what happened to cotton yield when India farmers began using GM cotton. Using GM cotton has moved India from a cotton importer to one of the top cotton exporters. A Cornell University and USAID funded project in Bangladesh more than doubled income for eggplant producers through the introduction of GM eggplant. Not having to control insects has also led to decreased clinical visits due to pesticide exposure since most farmers in developing countries do not use proper precautions when applying insecticides.
Producing more in the same area, or the same amount in less area, has the additional benefit to all of us by keeping food prices reasonable and decreasing agriculture’s carbon footprint. Fewer acres tilled or fewer trips through the field means less tractor time, therefore reducing fossil fuel use.


 Print
Print Email
Email


