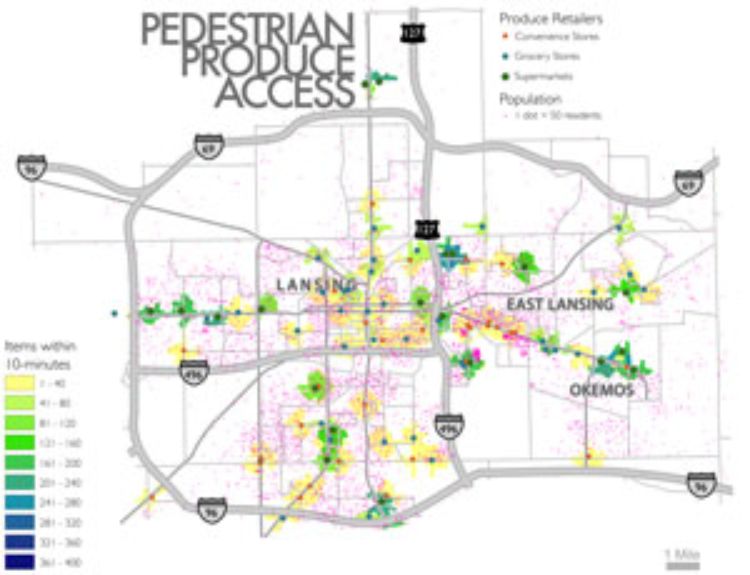
Interactive maps show availability of fresh produce
 Print
Print Email
EmailAgBioResearch scientist Phil Howard and his team are using interactive maps to show rather than simply tell how urban residents are losing access to fresh produce and balanced nutrition.
Maps are great for showing where things are. They’re also good for showing where things aren’t.
MSU AgBioResearch scientist Phil Howard and MSU geographer Kirk Goldsberry teamed up to develop interactive maps that offer a visual perspective of urban food deserts. By using geographic information systems technology, they are showing – rather than simply telling – how urban residents are losing access to fresh produce and balanced nutrition.
“The food system has become so complex that it’s difficult even for experts to figure out what is happening,” said Howard, an assistant professor in the MSU Department of Community, Agriculture, Recreation and Resource Studies. “Visuals, such as maps, are effective tools because our eyes can take in far more information than our other sensory organs, allowing us to process large amounts of data more easily and quickly.”
Howard and Goldsberry conducted their research in Lansing and other Michigan communities. They found that many supermarkets that served urban areas have closed and moved to the suburbs. They also showed that Michigan’s state capital is a model for what’s happening to food environments around the country.
“The change in food environments is occurring all over the nation,” Howard said. “The best selection of produce and the lowest prices have moved to the suburbs. So if you want lettuce in Lansing, or in most U.S. cities, you’re going to have to drive to get it.”
One aspect of the study focused on store locations. It showed that less than 4 percent of the greater Lansing area population lived within a 10-minute walk of a supermarket. The researchers also looked at the cost of reaching those stores as well as the availability of produce at each retail location. They took into account everything from urban party stores, which may offer lemons and limes, to suburban “big box stores,” which offer nearly 250 different produce items.
By taking food inventories and pairing that data with geospatial inputs, the team was able to precisely measure geographic access to store produce sections. What was revealed was a tale of two food environments. First, people with cars can overcome many geographical obstacles to obtain fresh produce, but pedestrians’ ability to obtain fresh produce is becoming increasingly challenged.
“I like to think of it as a nutritional CAT scan at the urban scale,” Goldsberry said. “The Lansing food model definitely favors drivers because the stores with the best selection of produce are farthest from the densest population areas.”
Howard added that the maps give residents, city officials and community organizations an outreach tool to visualize their food environment. Having a highly detailed method to examine each city’s food environment provides a graphic illustration of areas where produce is abundant and where it’s lacking. Howard hopes that the maps will also be useful for people trying to find a good location to establish a farmers’ market.
“When people see a map, they gravitate to their neighborhood and make a decision about how it stacks up to others,” he said. “They see a high-resolution image of their food environment that literally allows them to point out disparities and geographical challenges in their communities.”
For more information on the Lansing study, read: Visualizing Nutritional Terrain: A Geospatial Analysis of Pedestrian Produce Accessibility in Lansing, Michigan.