Flint
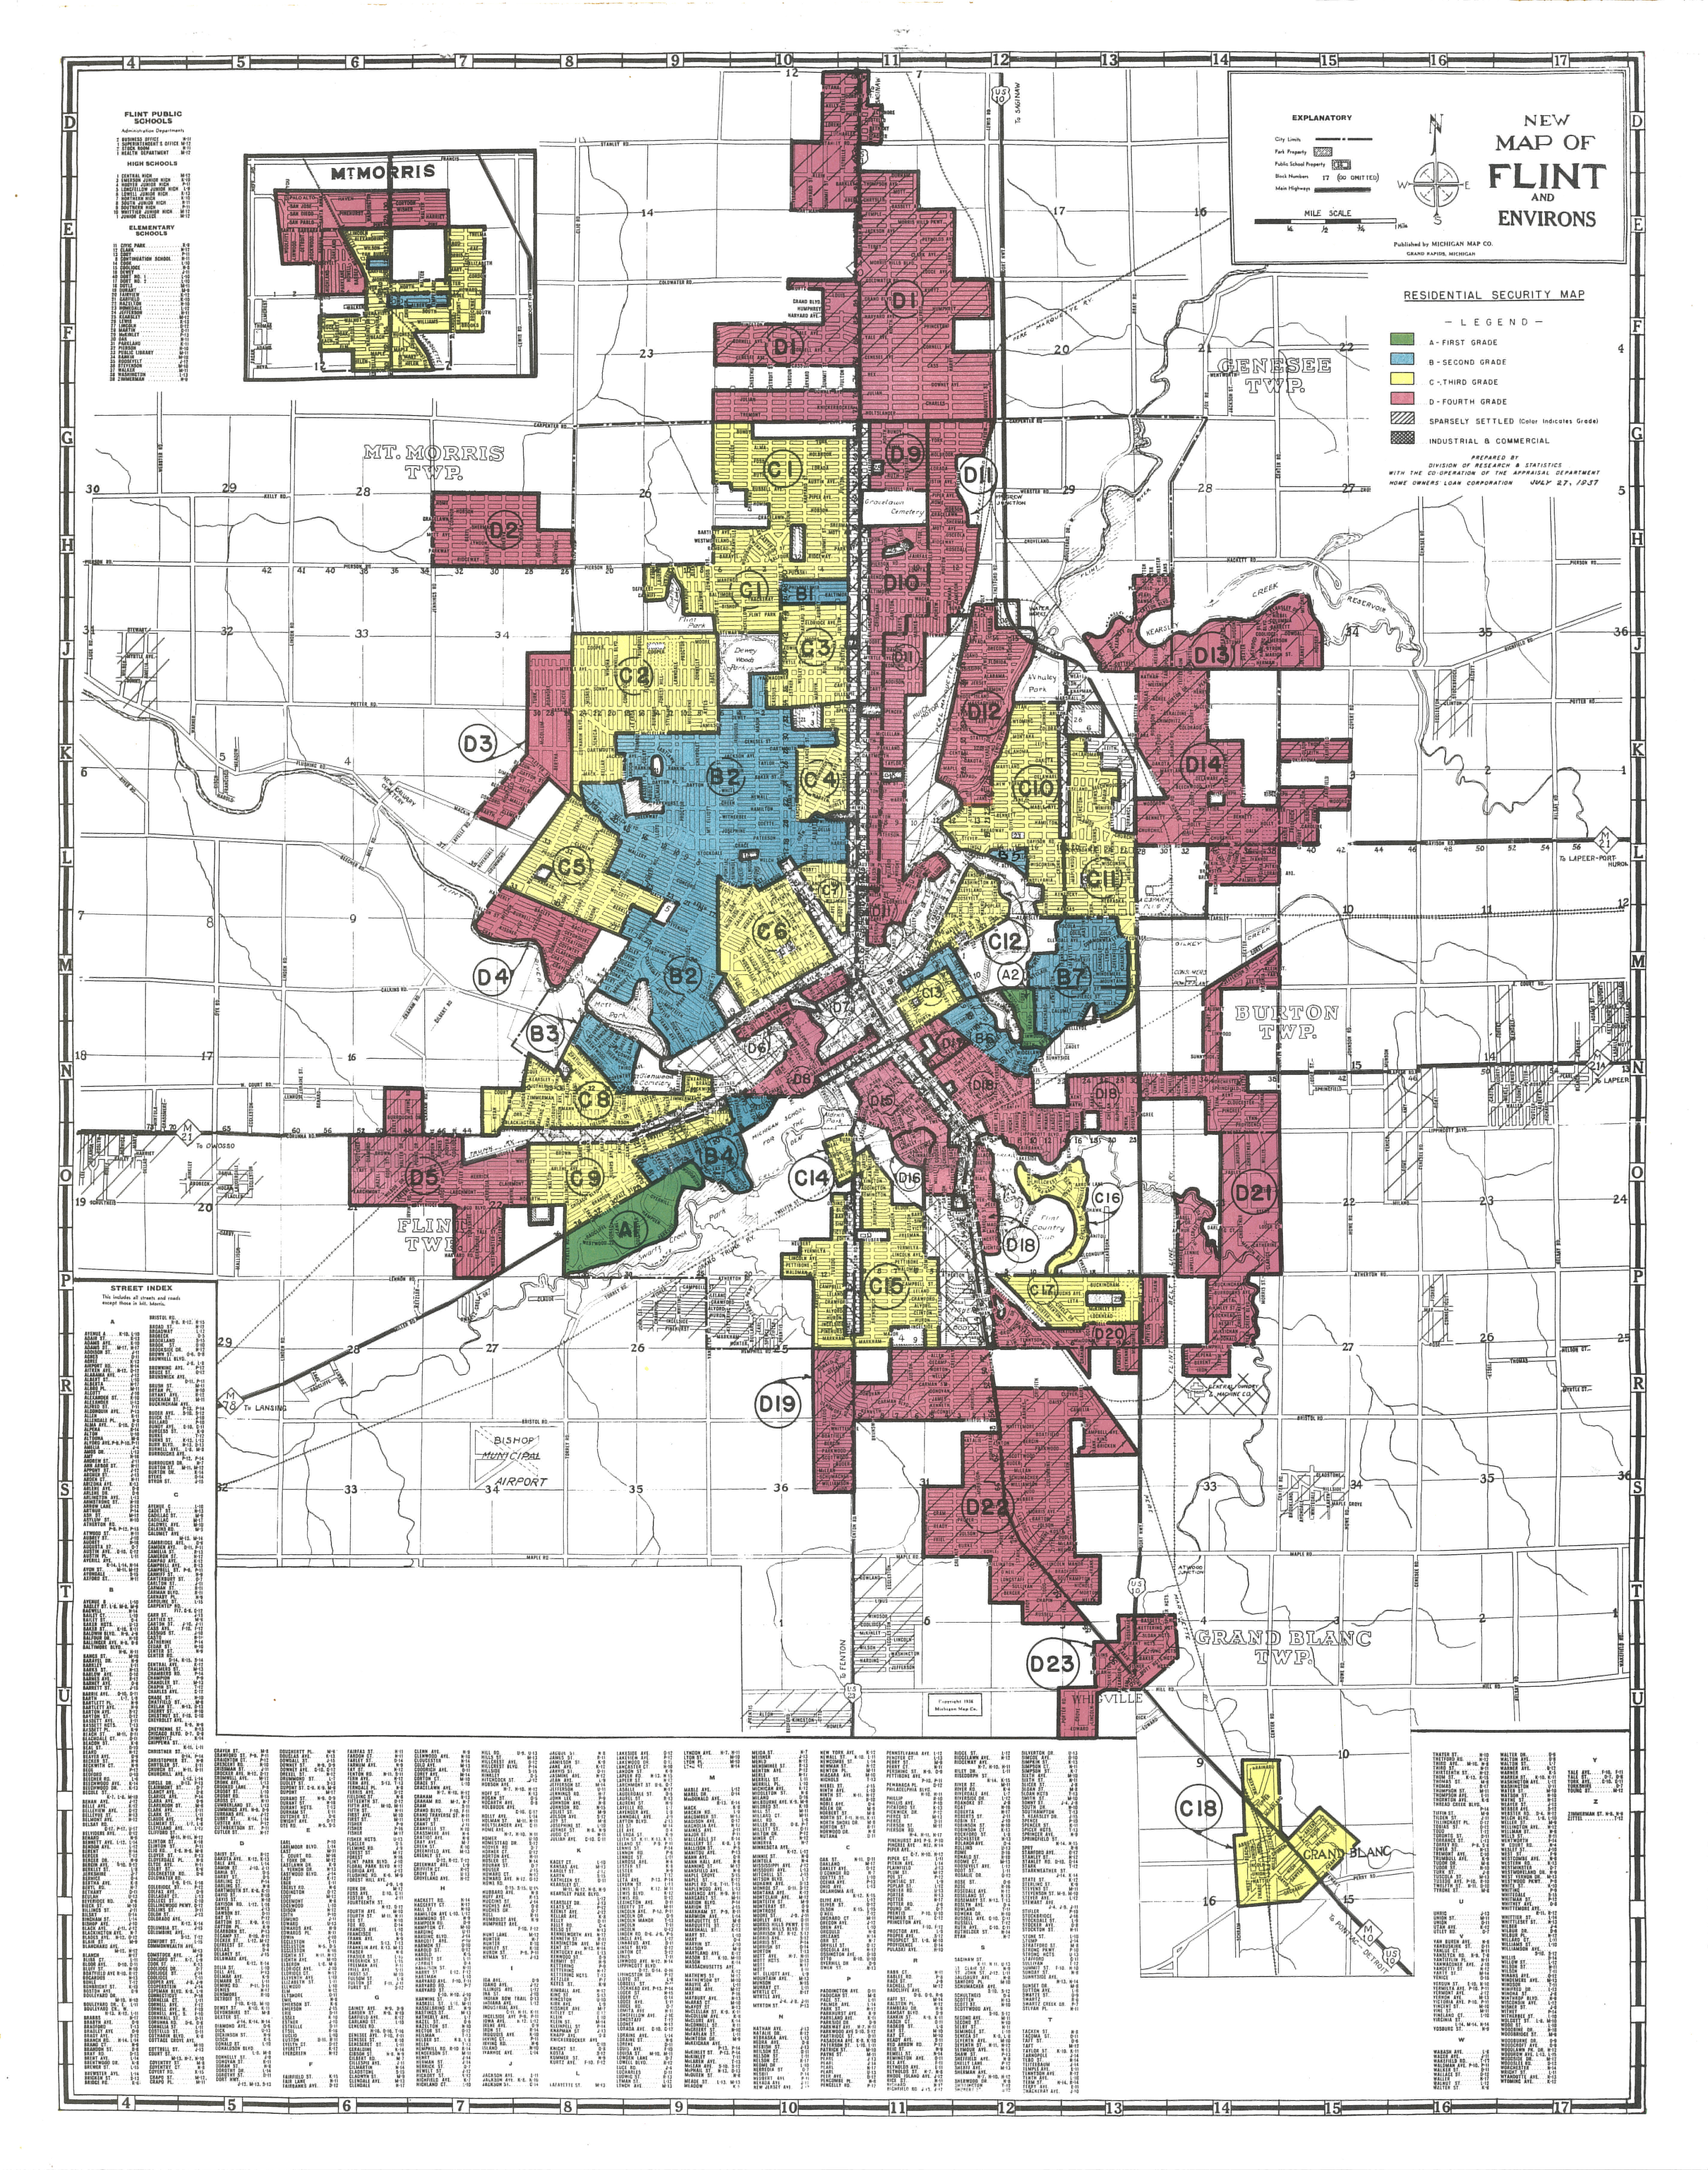
The federal government redline mapped Flint on July 27, 1937. Consistent with the requirements of the government Underwriting Manual, the redline mapping specifically targeted residents of color, deeming their neighborhoods as “hazardous” to investment because they had residents of color or were even near residents of color. The original redlining map is shown below. While HOLC did not itself implement these redlining maps, it promoted these practices and showed private industry groups and the FHA how to reproduce these maps. We also have a map overlaying the original HOLC boundaries on present-day segregation, which starkly show the continued effects of these racist practices. The strong visual connection between original HOLC grades and present-day racial segregation, shows a legacy of redline mapping on present-day outcomes.

Flint Neighborhood Grading Justifications
The racist language and explanations below are quoted from the “Area Description Files” filled out by government appraisers. The language and justifications are coarse and offensive. Nonetheless, it is important to remember our past in all of its coarseness is offensiveness to fully understand the context that we confront today, especially when developing equitable housing policies.
Redlined neighborhoods
Government appraisers redlined neighborhoods to the northeast “Undesirables – aliens and negroes” lived there; in the downtown center of Flint because of its age; and in southern neighborhoods because they were quickly and cheaply constructed for laborers.
Yellow-graded neighborhoods
Government appraisers graded northern neighborhoods yellow because there were adjacent to Buick and Chevrolet plants; and southern neighborhoods because they had “cheap showy construction – ‘Florida’ style.”
Blue-graded neighborhoods
Government appraisers graded neighborhoods as blue near the downtown rather than green because “Too close to ‘C’ and ‘D’ areas.” That is, too close to where Black people lived.
Government appraisers graded the neighborhood to the west blue because it was “built by a subsidiary of general Motors to house company employees.” They note that HOLC has insured 70 mortgages in this area.
Green-graded neighborhoods
Government appraisers gave the small green neighborhoods that rating because they were insulated from the other neighborhoods by blue-graded areas.
The Legacy of Redlining in Flint
We overlay the historical HOLC “redlining” map on present-day demographic data to show the persistence and continued relevance of these racist policies on present-day segregation. We mirror the racist HOLC color gradation to help visualize the continued segregation, as a lasting impact of redlining.

This research was conducted by Michigan State University Assistant Professor and Extension Specialist Craig Wesley Carpenter, Ph.D. (@DrCWCarpenter or cwcarp@msu.edu).


 Print
Print Email
Email