


Pontiac
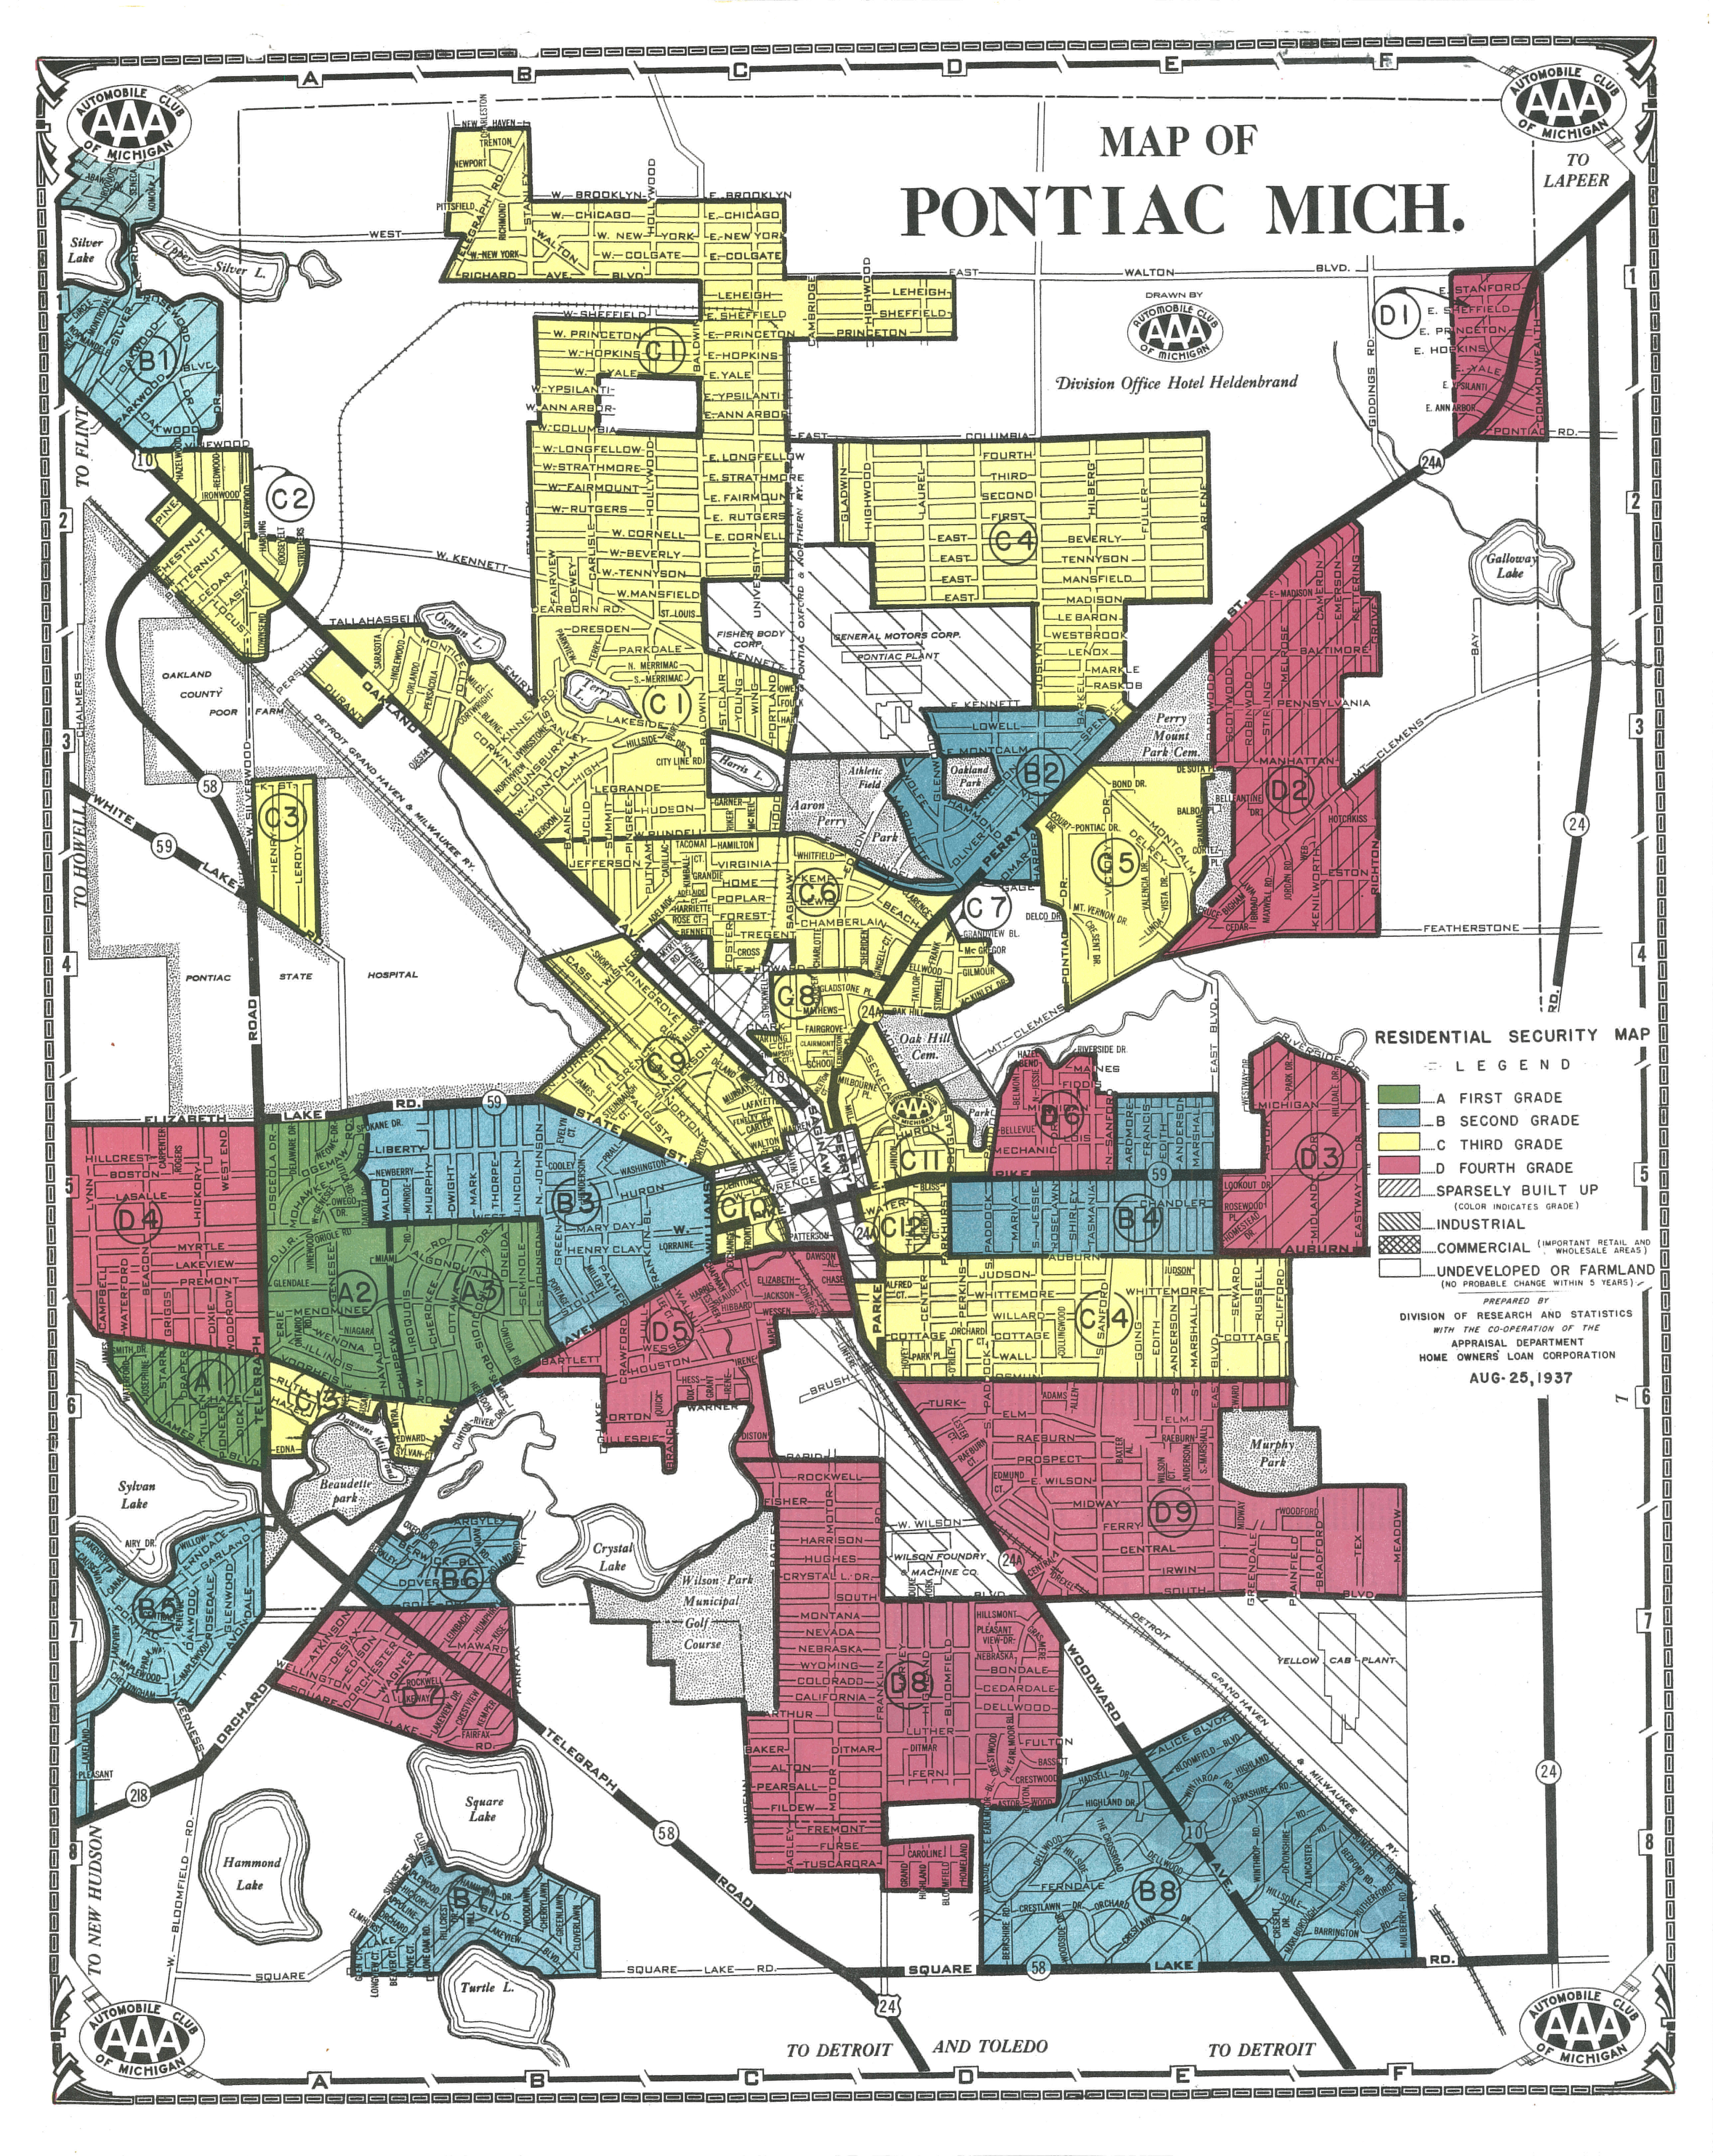
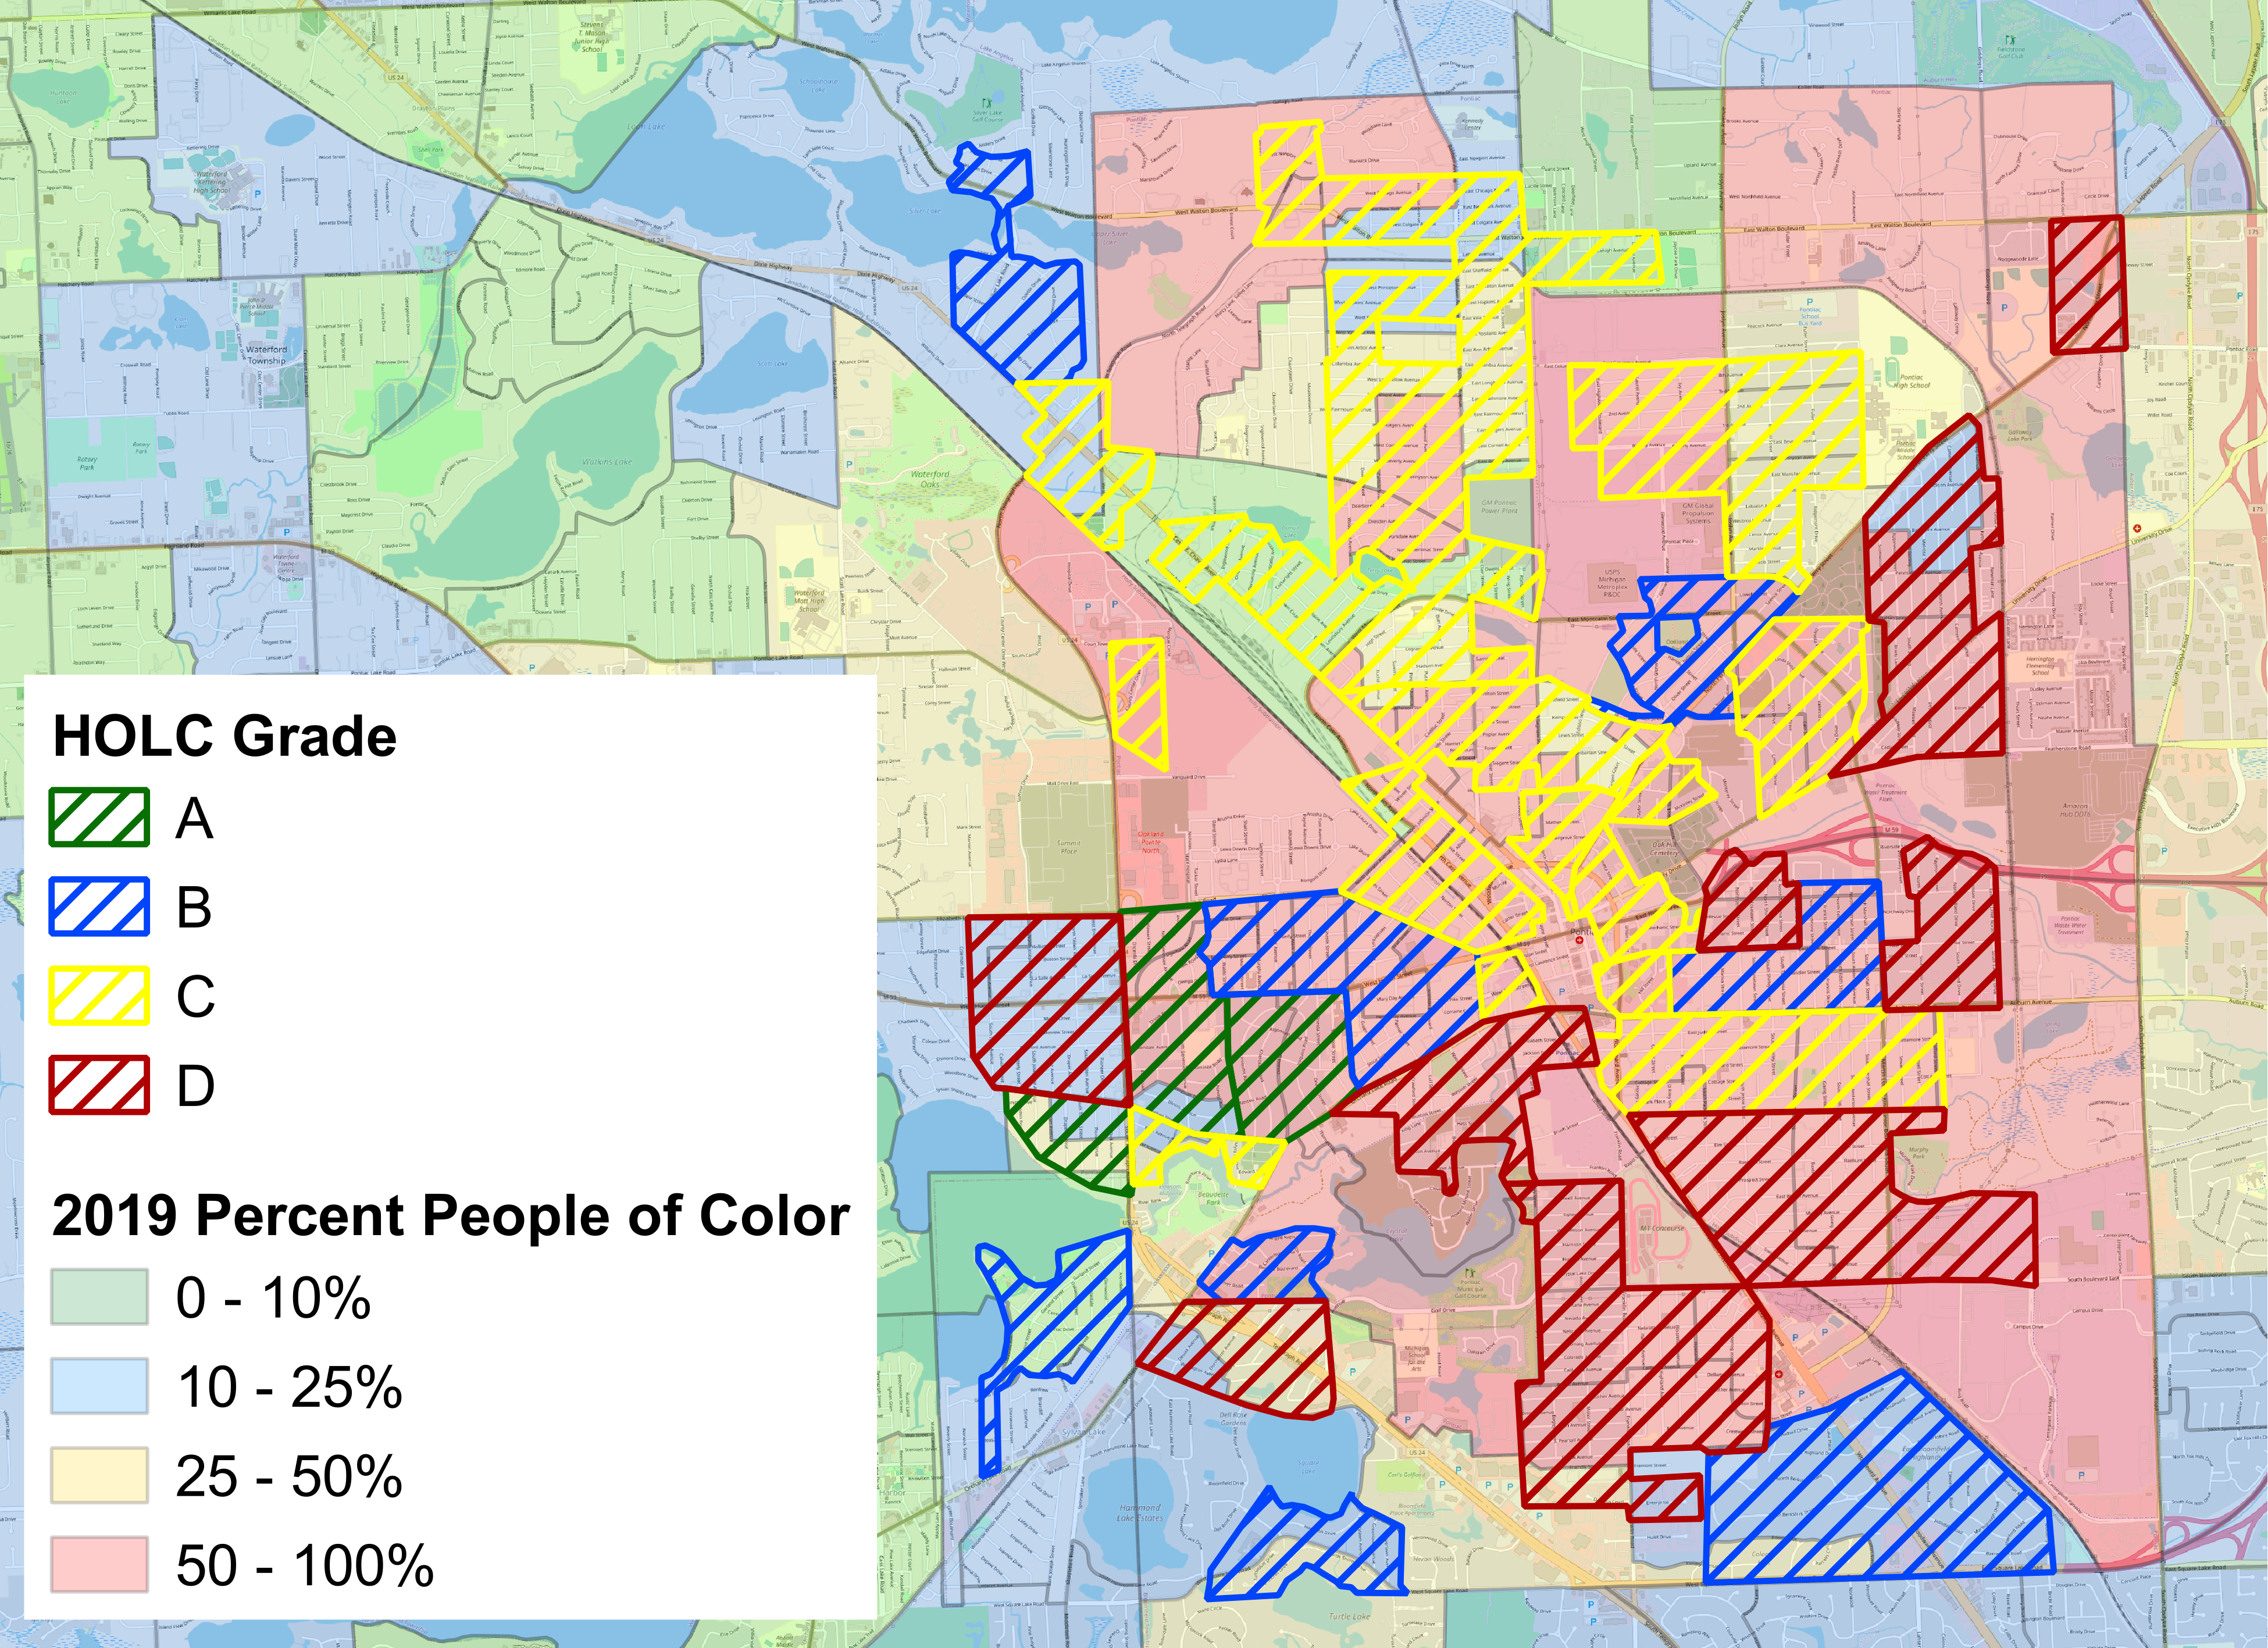
The federal government redline mapped Pontiac in August 25, 1937. Consistent with the requirements of the government Underwriting Manual, the redline mapping specifically targeted residents of color, deeming their neighborhoods as “hazardous” to investment because they had residents of color or were even near residents of color. The original redlining map is shown below. While HOLC did not itself implement these redlining maps, it promoted these practices and showed private industry groups and the FHA how to reproduce these maps. We also have a map overlaying the original HOLC boundaries on present-day segregation, which starkly show the continued effects of these racist practices. The strong visual connection between original HOLC grades and present-day racial segregation, shows a legacy of redline mapping on present-day outcomes.
Pontiac Neighborhood Grading Justifications
The racist language and explanations below are quoted from the “Area Description Files” filled out by government appraisers. The language and justifications are coarse and offensive. Nonetheless, it is important to remember our past in all of its coarseness is offensiveness to fully understand the context that we confront today, especially when developing equitable housing policies.
Redlined neighborhoods
Neighborhoods west of the city (near Sylvan Lake, Otter Lake, and Beaudette Park) was “bordering on Grade ‘A’, but not [racially] restricted” deed and covenants, so government appraisers redlined the area.
Government appraisers redlined Southern neighborhoods because they had “Alien and negro inhabitants.”
The east side neighborhood was noted to have an “Incineration plant near this section” and to lack racially exclusionary restrictions.
Yellow-graded neighborhoods
The northern neighborhoods (e.g., Pontiac Lakes and Osmun Lake) – “Home of automobile factory workers. Located near the Fisher Body and General Motors Truck plant.” – despite having “good schools” and “good transportation,” did not have racially-restrictive covenants or deeds.
The central neighborhoods are noted to be mostly rented and be “Very noisy” and have “High taxes.”
Blue-graded neighborhoods
The northern neighborhood (near Silver Lake and Hawthorne Park) despite having “Poor bus service” and “No sewers or sidewalks,” had “very highly” racially restricted deeds and covenants.
The southern neighborhoods (near Sylvan Lake), despite “Sewerage disposal is poor” and “No transportation” and being “Unhandy to schools” had restrictive zoning.
Green-graded neighborhoods
Unlike the unrestricted redlined area adjacent, these southwest neighborhoods (then “Indian Village,” “Ottawa Hills,” and “Seminole Hills”) had “Highly restricted” (“Nearly all home owners.”) deeds and covenants, as well as segregated schools. Government appraisers allowed these neighborhoods to be adjacent to a redlined neighborhood because “Telegraph road separates this section.” Zoning is noted as a tool of exclusion.
The Legacy of Redlining in Pontiac
We overlay the historical HOLC “redlining” map on present-day demographic data to show the persistence and continued relevance of these racist policies on present-day segregation. We mirror the racist HOLC color gradation to help visualize the continued segregation, as a lasting impact of redlining.
Higher segregation is associated with lower incomes, lower educational attainment, more crime, worse health outcomes, and higher inequality. But segregation is not the only lasting impact of redlining in Michigan Cities, or in Pontiac. Researchers have shown that redlining also directly reduced many of these outcomes.
This research was conducted by Michigan State University Assistant Professor and Extension Specialist Craig Wesley Carpenter, Ph.D. (@DrCWCarpenter or cwcarp@msu.edu).
 Print
Print Email
Email