

Heads In, Hearts In: Photo-Graph
DOWNLOADMay 25, 2021 - MSU Extension
 Print
Print Email
EmailWhat you need to know:
A graph is a way to show numbers in a chart or picture. A bar graph is used to show information in lines using columns and rows. A column is vertical or upright, and information is shown stacked on top of each other. A row is horizontal, and information is displayed in a left-to-right fashion or side by side.
What you will do and learn:
This activity will help you practice counting and grouping items and then displaying or graphing your results. In this activity, you will identify shapes, count the number of matching pictures, and then use a bar graph to display the results.
Other Documents in this Series
You Might Also Be Interested In
-
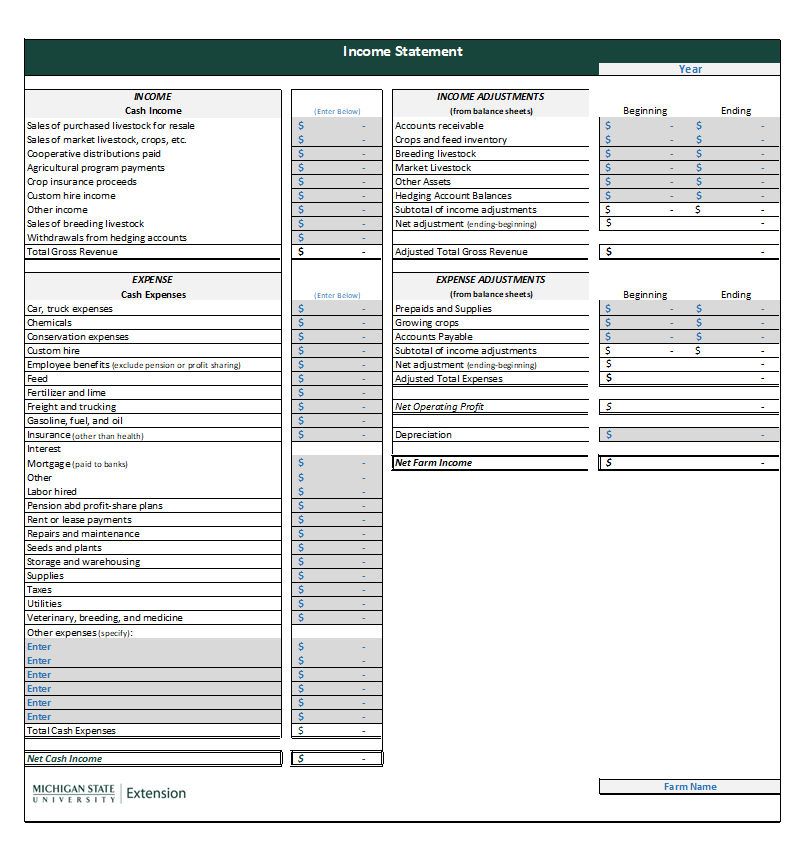
Income Statement Walkthrough Videos
Published on January 31, 2024
-
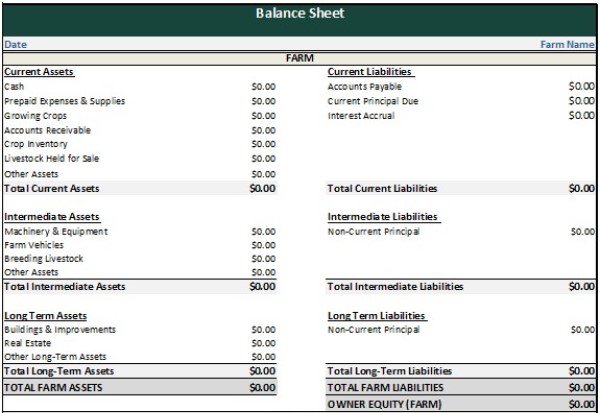
Balance Sheet Walkthrough Videos - Intermediate Assets
Published on January 31, 2024
-
Balance Sheet Walkthrough Videos - Current Assets
Published on January 31, 2024
-
Balance Sheet Walkthrough Videos - Long Term Assets
Published on January 31, 2024
-
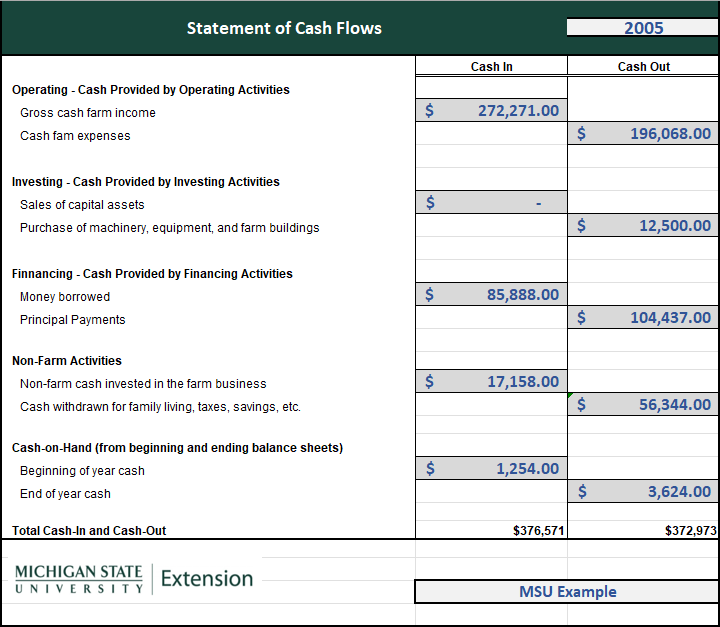
Cash Flow Statement Walkthrough Videos
Published on January 31, 2024
-
Home Lawn and Garden Soil Test Mailer from MSU Extension
Published on January 23, 2025
Accessibility Questions:
For questions about accessibility and/or if you need additional accommodations for a specific document, please send an email to ANR Communications & Marketing at anrcommunications@anr.msu.edu.