ARPA Fiscal Recovery in Michigan - 2021
Planning and spending of American Rescue Plan Act Coronavirus State and Local Fiscal Recovery Fund dollars in 2021 by Michigan’s largest grant recipients.

The Michigan State University Extension Center for Local Government Finance and Policy (Center) began tracking planning and spending of American Rescue Plan (ARPA) State and Local Fiscal Recovery Funds (SLFRF) at the state and local level in late 2021. Mandatory reporting from local recipients to the Treasury began in late 2021. This data was not initially available or complete. The Center utilized multiple sources to compile information in the interim:
1) For State-level data, the Center utilized publicly available information from the U.S. Treasury as well as data released via other university centers in addition to discussions with local government representatives via the Center’s long-standing Government Fiscal Sustainability Workgroup.
2) For fund use and planning data at the local (county, township, city) level, the Center collected mandatory Interim Reports, Planning and Expenditure (P&E) reports, and Recovery Plan Performance Reports for those units that had completed these items (see primary report PDF at the bottom of this page for details).
3) For further context around key decision maker behavior, the Center utilized survey findings from three regional survey instruments, two interviews with the Chief Financial Officer of localities that have been under state oversight, as well as informal interviews with several state-level officials responsible for the fiscal oversight of local units of government. In total, the surveys gathered 120 responses from members across 20 Michigan counties.
Many factors influence local government spending decisions of SLFRF, including the program rollout timeline. A SLFRF-like program was vigorously requested by state and local officials and their lobbying apparatuses long before the program was announced. However, through program rollout, the Treasury Department has acknowledged that some local governments experienced and continue to experience technical and administrative issues with this program. These problems are not limited to the smallest local units who are not used to this kind (or quantity) of federal aid. Of the many challenges identified in our research, key hurdles relate to reporting compliance and coordination, regional coordination (or multi-jurisdictional use of funds), resources (including the issue of short timeframes and single audit requirements), issues of politics and transparency, as well as issues held by the Center’s research team, such as data availability (and misunderstandings related to what information should be available to the public). Major program challenges include: determining allowable activities in a dynamic environment where the most recent version of the Treasury’s Compliance and Reporting Guidance for SLFRF is on version 4.1 as of June 17, 2022; identifying projects that can be leveraged with other state and/or federal funding in an environment where information about these supplemental resources are unknown; combating unease and dampened inertia accompanying lack of clarity regarding future oversight and compliance requirements (and penalties); addressing the cognitive dissonance experienced with identifying “transformative” projects that will “drive equity” with SLFR funds at the same time as being “fiscally responsible”; and investing in projects that will not require any additional resources in future (or planning around future potential project costs with one-time money).
Eventually all Michigan local governments receiving funds will be required to report SLFRF funded projects to the Treasury, accounting for the full $4.4 billion in funds disbursed by Treasury. At the time of writing the initial report, the P&E reports collected by the Center reflected $3.4 billion dollars in SLFRF program allocations across 61 local units of government and 226 unique projects (some without any funds obligated as of writing). See Table 1 for a detailed breakdown of these units with total award and demographic information.
Table 1. Total Award Allocations, Per Capita Values, and Obligation and Expenditure Percentages for the 64 Units of Government Receiving Greater Than $10 million
|
Local Unit |
Type |
Allocation $ |
Population ('19) |
$/capita |
% Spent |
% Obligated |
|---|---|---|---|---|---|---|
|
Allegan |
County |
22,935,850 |
118,081 |
194.2383 |
0.03% |
0.03% |
|
Ann Arbor |
City |
24,182,630 |
119,980 |
201.5555 |
0.00% |
0.00% |
|
Barry |
County |
11,955,366 |
61,550 |
194.2383 |
0.00% |
0.00% |
|
Battle Creek |
City |
30,545,339 |
51,093 |
597.838 |
2.70% |
4.56% |
|
Bay |
County |
20,031,017 |
103,126 |
194.2383 |
0.00% |
0.00% |
|
Bay City |
City |
31,076,578 |
32,717 |
949.8603 |
0.08% |
7.72% |
|
Berrien |
County |
29,796,346 |
153,401 |
194.2383 |
2.36% |
2.36% |
|
Calhoun |
County |
26,058,813 |
134,159 |
194.2383 |
34.74% |
34.74% |
|
Cass |
County |
10,059,018 |
51,787 |
194.2383 |
0.00% |
0.00% |
|
Clinton |
Twp |
14,816,245 |
100,471 |
147.4679 |
0.00% |
0.00% |
|
Clinton |
County |
15,460,396 |
79,595 |
194.2383 |
11.86% |
11.86% |
|
Dearborn |
City |
47,212,828 |
93,932 |
502.6277 |
0.00% |
0.00% |
|
Dearborn Heights |
City |
24,314,463 |
55,353 |
439.2619 |
0.00% |
0.00% |
|
Detroit |
City |
826,675,290 |
670,031 |
1233.787 |
0.57% |
6.54% |
|
East Lansing |
City |
12,170,077 |
48,145 |
252.7797 |
0.00% |
0.00% |
|
Eaton |
County |
21,418,266 |
110,268 |
194.2383 |
10.28% |
49.36% |
|
Flint |
City |
94,726,664 |
95,538 |
991.5077 |
0.00% |
0.00% |
|
Genesee |
County |
78,824,418 |
405,813 |
194.2383 |
1.18% |
2.89% |
|
Grand Rapids |
City |
92,279,500 |
201,013 |
459.0723 |
25.90% |
27.18% |
|
Grand Traverse |
County |
18,081,253 |
93,088 |
194.2383 |
0.00% |
0.00% |
|
Ingham |
County |
56,796,438 |
292,406 |
194.2383 |
27.79% |
52.12% |
|
Ionia |
County |
12,566,634 |
64,697 |
194.2383 |
0.00% |
0.00% |
|
Isabella |
County |
13,571,817 |
69,872 |
194.2383 |
7.78% |
7.78% |
|
Jackson |
County |
30,788,709 |
158,510 |
194.2383 |
15.22% |
30.39% |
|
Jackson |
City |
31,444,825 |
32,440 |
969.3226 |
0.24% |
0.53% |
|
Kalamazoo |
County |
51,485,963 |
265,066 |
194.2383 |
0.11% |
0.21% |
|
Kalamazoo |
City |
38,872,877 |
76,200 |
510.1427 |
0.08% |
2.83% |
|
Kent |
County |
127,605,807 |
656,955 |
194.2383 |
0.00% |
0.00% |
|
Lansing |
City |
49,924,664 |
118,210 |
422.3388 |
0.00% |
0.00% |
|
Lapeer |
County |
17,016,633 |
87,607 |
194.2383 |
4.12% |
20.68% |
|
Lenawee |
County |
19,122,953 |
98,451 |
194.2383 |
0.51% |
0.51% |
|
Lincoln Park |
City |
19,146,461 |
36,321 |
527.1458 |
0.02% |
65.18% |
|
Livingston |
County |
37,292,778 |
191,995 |
194.2383 |
1.59% |
2.17% |
|
Macomb |
County |
169,758,815 |
873,972 |
194.2383 |
- |
- |
|
Marquette |
County |
12,955,499 |
66,699 |
194.2383 |
0.00% |
0.00% |
|
Midland |
County |
16,152,078 |
83,156 |
194.2383 |
16.10% |
16.10% |
|
Monroe |
County |
29,232,861 |
150,500 |
194.2383 |
0.99% |
0.99% |
|
Monroe |
City |
11,405,523 |
19,552 |
583.343 |
0.66% |
4.87% |
|
Montcalm |
County |
12,409,495 |
63,888 |
194.2383 |
11.10% |
16.10% |
|
Muskegon |
County |
33,713,161 |
173,566 |
194.2383 |
- |
- |
|
Muskegon |
City |
22,881,894 |
36,565 |
625.7868 |
0.00% |
0.00% |
|
Muskegon Heights |
City |
10,684,772 |
10,736 |
995.2284 |
- |
- |
|
Oakland |
County |
244,270,949 |
1,257,584 |
194.2383 |
7.18% |
7.18% |
|
Ottawa |
County |
56,684,556 |
291,830 |
194.2383 |
20.76% |
20.76% |
|
Pontiac |
City |
37,717,953 |
59,438 |
634.5764 |
0.00% |
0.00% |
|
Port Huron |
City |
17,959,874 |
28,749 |
624.713 |
5.10% |
6.66% |
|
Redford |
Twp |
21,962,768 |
46,674 |
470.5568 |
2.41% |
7.81% |
|
Roseville |
City |
14,393,345 |
47,018 |
306.1241 |
4.75% |
22.76% |
|
Royal Oak |
City |
28,107,502 |
59,277 |
474.1721 |
0.65% |
1.78% |
|
Saginaw |
County |
37,009,967 |
190,539 |
194.2383 |
2.08% |
2.08% |
|
Saginaw |
City |
52,089,151 |
48,115 |
1082.597 |
0.00% |
0.00% |
|
Shiawassee |
County |
13,231,900 |
68,122 |
194.2383 |
21.17% |
21.17% |
|
St Clair |
County |
30,908,749 |
159,128 |
194.2383 |
0.02% |
0.02% |
|
St Clair Shores |
City |
21,247,393 |
58,984 |
360.223 |
3.53% |
4.71% |
|
St Joseph |
County |
11,841,542 |
60,964 |
194.2383 |
0.00% |
0.00% |
|
Sterling Heights |
City |
19,837,262 |
132,438 |
149.7853 |
2.74% |
2.74% |
|
Taylor |
City |
11,593,181 |
60,922 |
190.2955 |
5.08% |
5.20% |
|
Tuscola |
County |
10,147,979 |
52,245 |
194.2383 |
1.54% |
1.54% |
|
Van Buren |
County |
14,699,370 |
75,677 |
194.2383 |
1.07% |
1.07% |
|
Warren |
City |
27,318,439 |
133,943 |
203.9557 |
2.55% |
3.13% |
|
Washtenaw |
County |
71,402,185 |
367,601 |
194.2383 |
0.03% |
0.06% |
|
Wayne |
County |
339,789,370 |
1,749,343 |
194.2383 |
0.34% |
1.18% |
|
Westland |
City |
25,932,032 |
81,511 |
318.1415 |
0.00% |
0.00% |
|
Wyoming |
City |
13,155,842 |
75,667 |
173.865 |
0.00% |
0.54% |
Note: Blank percentage obligated and spent columns indicate that Center staff were not successful getting the SLFRF Compliance Project and Expenditure Report for March – December 2021 from those local governments. Staff requested many of these compliance reports through Freedom of Information Act requests.
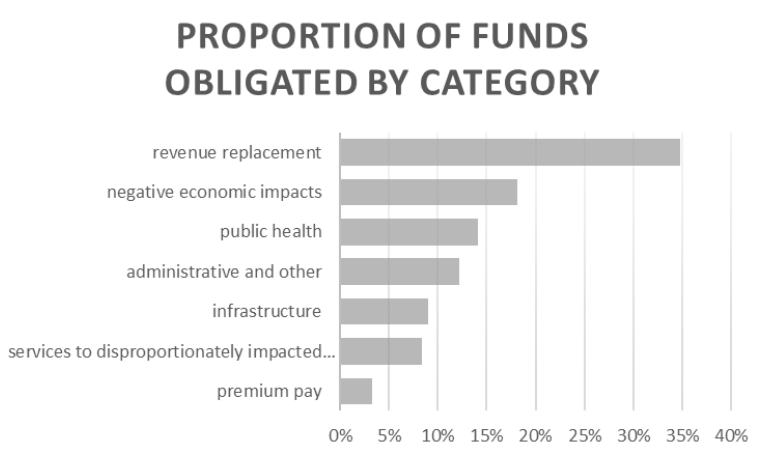
The 61 units reporting range from localities like Cass county (population 51,787) and Tuscola County (population 52,245), each receiving just over $10 million in funds, to large metropolitan localities like Wayne County (population 1.7 million) and the City of Detroit (population 670,031), who received $340 million and $827 million, respectively. Of the $3.4 billion these units have available to spend, only $218 million had been obligated in total as of January 2022. Of the 7 major Treasury spend categories (Revenue Replacement, Negative Economic Impacts, Public Health, Administration and Other, Infrastructure, Services to Disproportionately Impacted Communities, and Premium Pay), revenue replacement was the largest category for obligated and expended project funds at 35% of all obligations (and 54% of those expended). This was unsurprising, given the broad latitude given by the Treasury to categorize spending as “revenue replacement”. Since the compilation of this report, new analyses conducted by the Center utilizing data from the next reporting period (March 2022) show this category growing. This change follows modifications in the Final Rule that make this allocation category the most straightforward way to allocate funds before the 2024 deadline. Regional survey results gathered for this report support this finding, with 75% of local government representatives across 20 Michigan counties indicating that their communities intend to take the standard allowance for lost revenue. Initial results of further surveys mid-2022 echo this.
The remaining categories had proportions of obligated project funds as follows: Negative Economic Impacts (18%), Public Health (14%), Administration and Other (12%), Infrastructure (9%), Services to Disproportionately Impacted Communities (8%), and Premium Pay (3%). See Figure 1 (Figure 5 in the primary report).
Figure 1. Spending by Category
Expenditures in the Administration and Other category highlight the need many communities feel to hire additional staff or consultants to oversee fund usage or to assist in the lost revenue calculations. This highlighted survey results that indicated that the number 1 type of support needed by local governments is help with documentation of fund usage per Treasury’s guidelines.
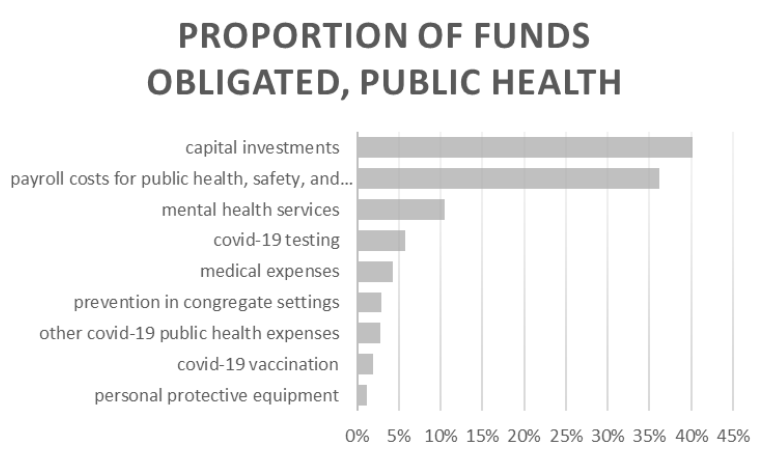
The vast majority of unique spending obligations fall under the categories of Public Health and Negative Economic Impacts at 14% and 18% of total obligated dollars, respectively. In the category of public health, capital investments made up the largest proportion of obligated money. Figure 2 (Figure 6 in the primary report) explores how funds in the category of public health are being used. These projects largely relate to upgrades to public buildings and spaces to help with social distancing and work from home measures. Expansion of internet and cybersecurity capabilities were also a large part of this category, with some overlap into the “other covid-19 public health expenses category”. Payroll for Covid-19 leave and public safety workers made up the second largest designation of funds in this category. Many localities listed separate projects for purchases of Personal Protective Equipment, but these were by far the least expensive projects.
Figure 2. Spending by Sub-category: Public Health
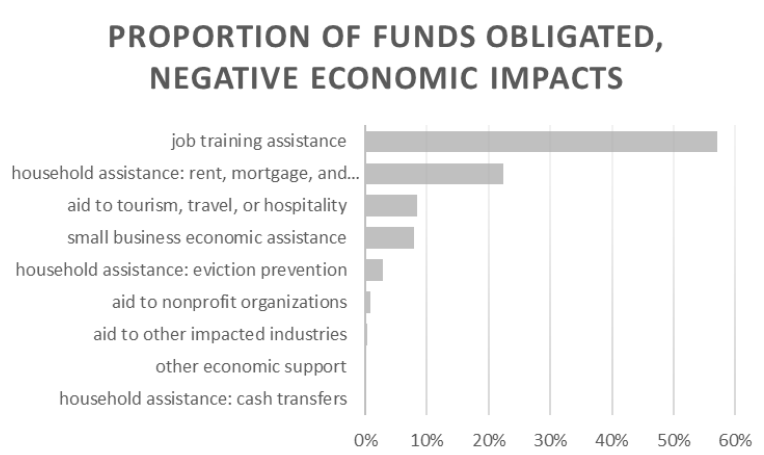
Similarly, projects for which funds were obligated in the category of negative economic impacts belong broadly to two areas: job training assistance and household rental, mortgage, and utility assistance. See Figure 3 (Figure 7 in the primary report). Notably, the City of Detroit made up the entirety of obligated funds for job training, allocating over $16 million in funds to Skills for Life career training and education program through Detroit at Work and the City’s General Services Department. The funds specifically will be used to support unemployed or underemployed Detroit residents in gaining access to work while providing wrap-around support services (e.g., childcare subsidies, transportation, among others). Ingham county and the cities of Kalamazoo, Roseville, and Sterling Heights all obligated funds towards various direct household rent, mortgage, and utility programs for those in need.
Figure 3. Spending by Sub-category: Negative Economic Impacts
To reiterate, these metrics only account for $218 million of the $3.4 billion allocated to large local governments in Michigan. Through this program, Congress allocated funds to tens of thousands of eligible general purpose local governments (as well as sovereign Tribal governments and U.S. territories). Future reports will include more of these local units, both within Michigan and neighboring states. The majority of the recipients are early in the process of project planning and fund spending. Subsequent reports are likely to contain a more complete picture. The Center plans to continue to monitor fund usage and the challenges local governments are facing utilizing SLFRF until all the funds are spent in 2026.


 Print
Print Email
Email


