East central Michigan regional hop report for July 15-23, 2023

Hops are on track in east central Michigan.

Hop plants growing on a trellis.
MI Centennial. Photo by Top Hops Farm.

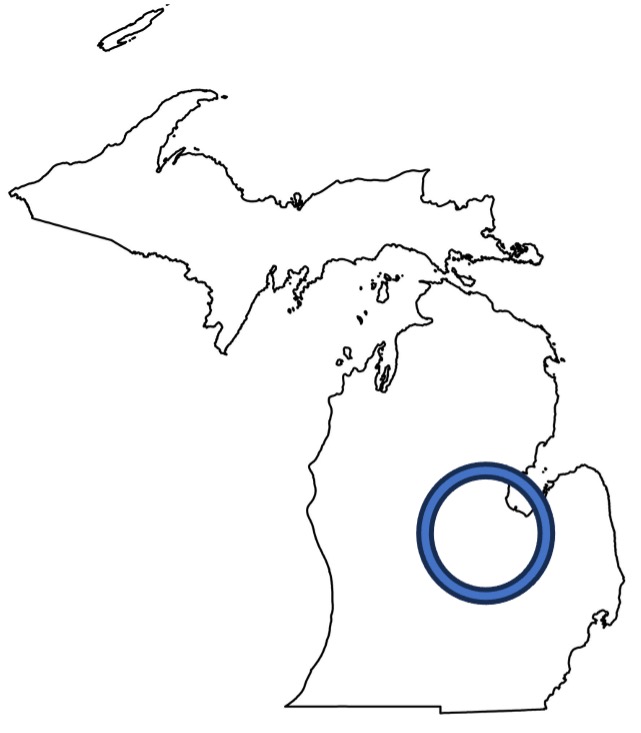
Location: East Central Michigan

Flint MI map.jpg

Bar graph that indicates the temperature, soil moisture, growth, disease pressure and insect pressure this season compared to a “normal” season

US Drought Monitor Map that shows the intensity of drought across Michigan as of July 18, 2023

Precipitation graph by month showing April, May, June 2023 compared to 2022 and long term average.

Daily temperature chart from March 1-July 23, 2023 with average low and high temperatures

Accumulated Growing Degree Day Chart that shows accumulated growing degree days (Base 50) compared to highest, lowest, and normal (April 1- July 23, 2023)

Comments

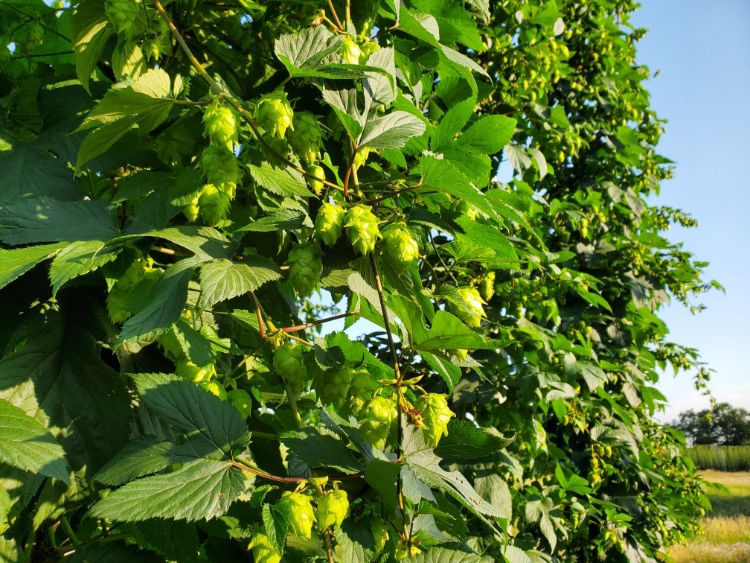
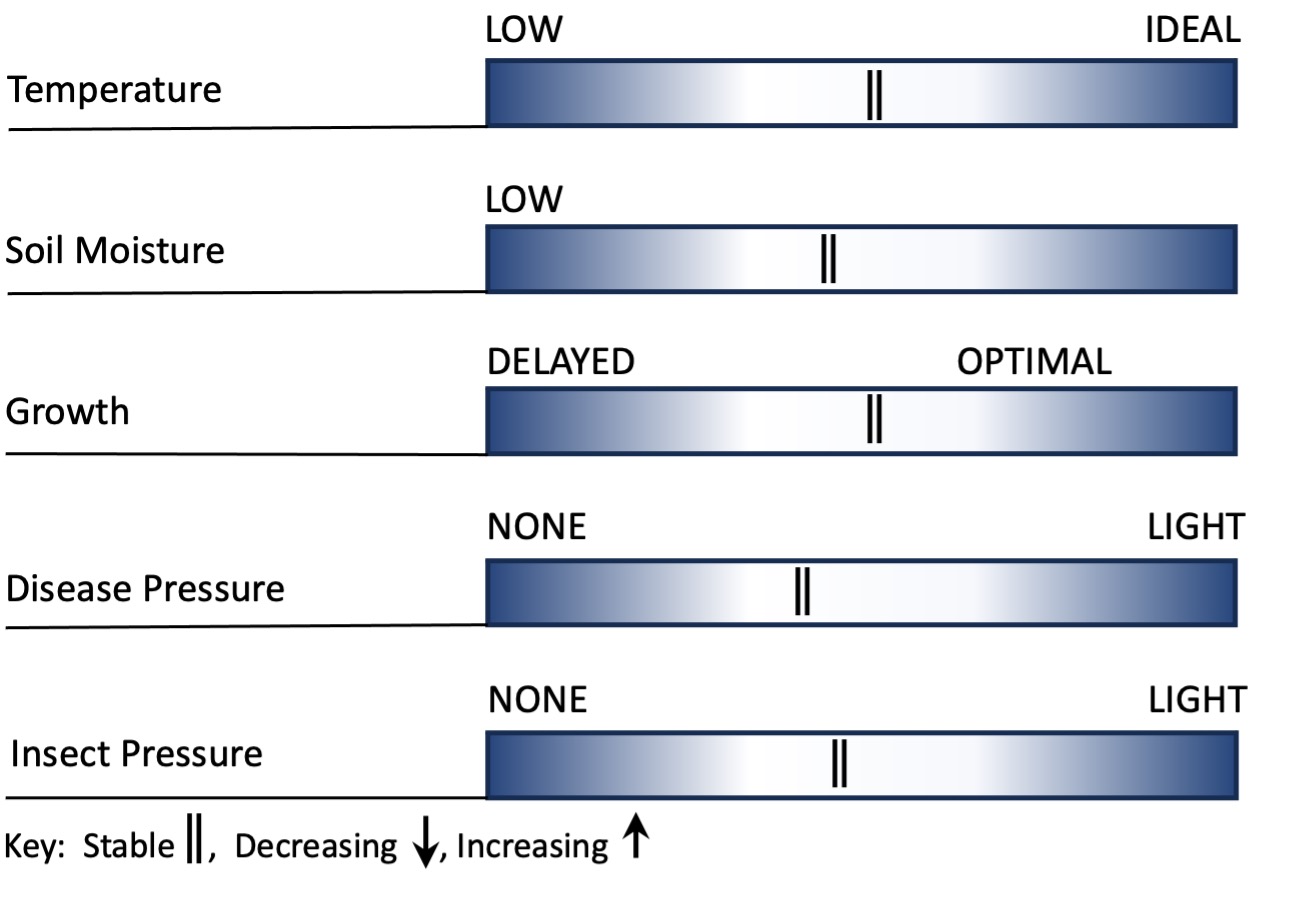
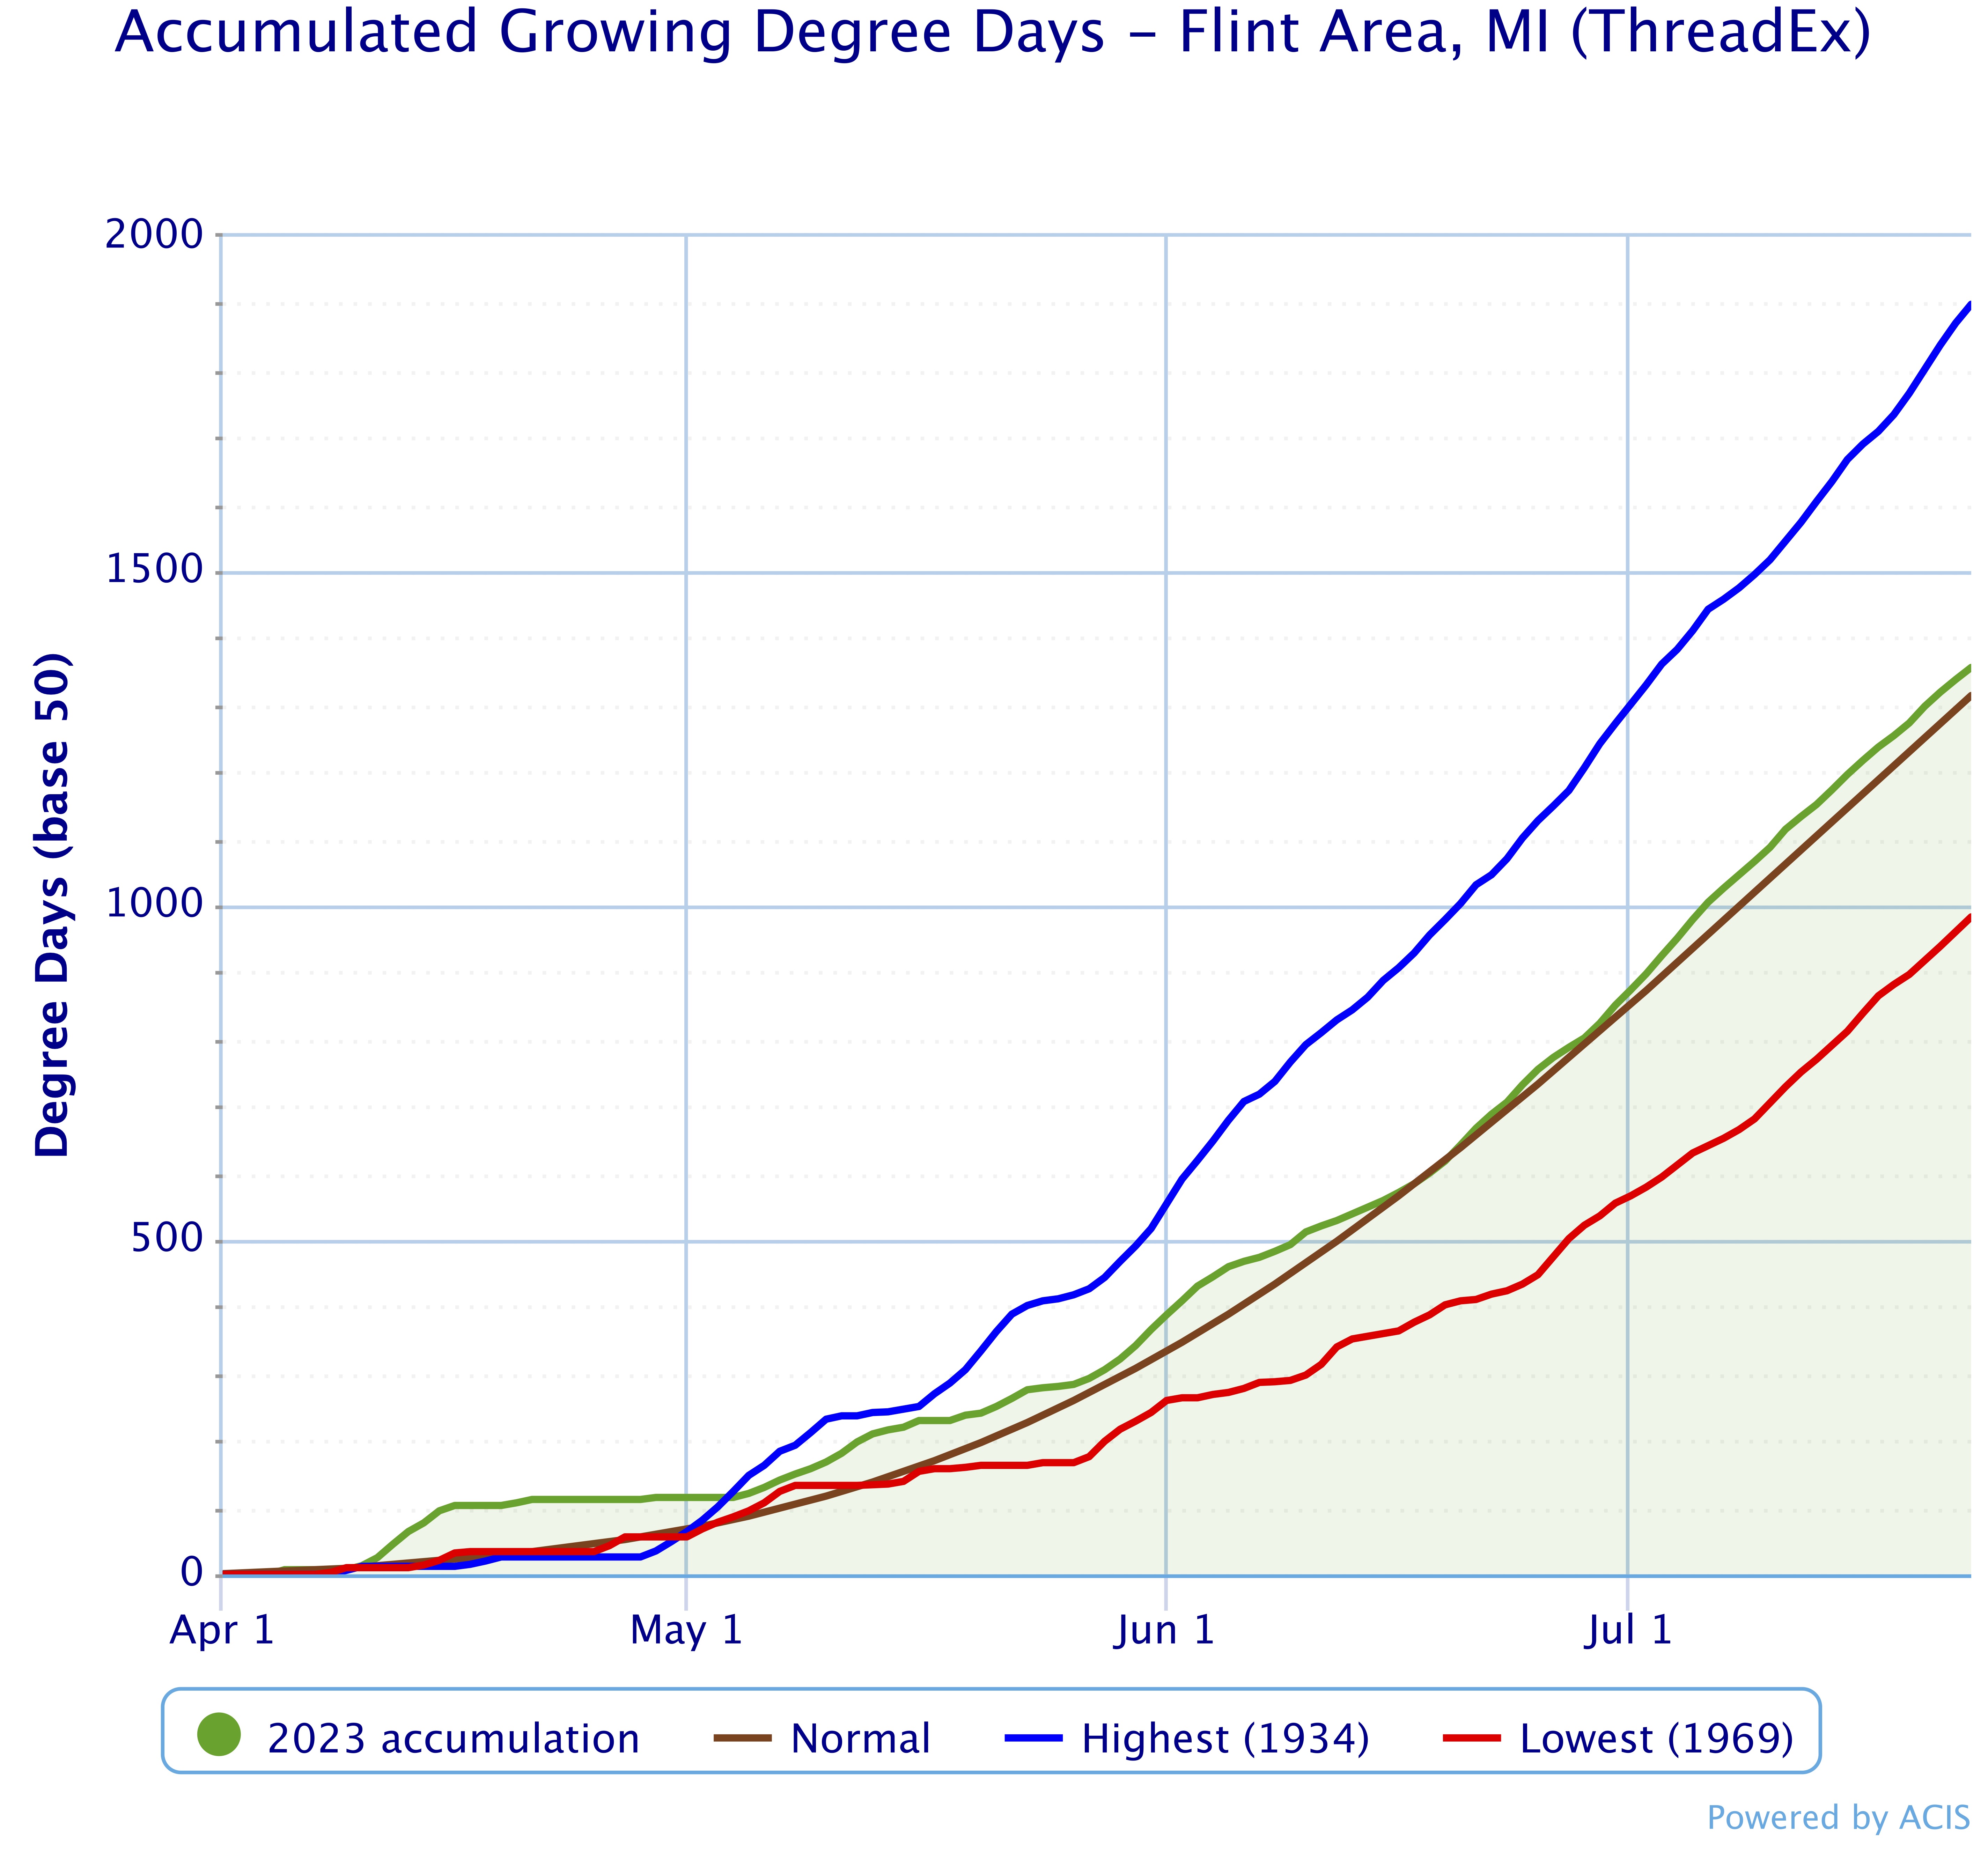
Cones are apparent in early to mid-harvested varieties. Growing degree accumulation is just above average. Growers are scouting for mites and Japanese beetles. Precipitation and more moderate temperatures have likely lessened mite pressure. Disease pressure remains low. Yield estimates appear to be above average.

Did you find this article useful?