ARPA Coronavirus Local Fiscal Recovery Funds in Michigan: Spending Plans as of April 2022
 Print
Print Email
EmailJust over 17% of the $4.4 billion allocated to Michigan local governments have been spent. Nearly $3.6 billion funds remain unobligated, $3 billion to be spent by 64 large Michigan local governments, while $642 million for the remaining.
The Covid-19 health crisis has had an unprecedented impact on the lives of nearly every person and organization on earth. Local governments are under strain as they face lost revenues, higher expenses, increased remote work, service challenges and the long-term financial implications of each. This extraordinary series of events has affected Michigan’s 1,856 local governments.
In response to the sudden and severe impacts on the economy across the U.S, the federal government enacted the American Rescue Plan Act (ARPA) spending package providing $1.9 trillion for public health efforts fighting COVID-19, extending and expanding tax and economic incentives for individuals, families and businesses, and providing grant aid to states, localities, tribes, and territories. A total of $130 billion of that funding has been directed specifically to local governments through the Coronavirus Local Fiscal Recovery Fund (‘LFRF’). Nearly every local government in the country has received some level of funding from this program. In Michigan, a total of $4.4 billion was distributed to local governments, either directly from the Treasury or through the state.
In this report we consider primary planning and expenditure data gathered by the Center throughout early 2022 in combination with the newly released fiscal recovery funds usage data from the Treasury (covering reporting periods up to April 2022). We also utilize surveys of Michigan residents and local government officials to provide background and context for the current spread of fund usage. Surveys include the spring 2022 Michigan Public Policy Survey (MPPS), conducted between April 4 and June 6, 2022 (More at: http://mpps.umich.edu) and the spring 2022 State of the State Survey (SOSS), conducted between April 12 - April 21, 2022 (More at: http://ippsr.msu.edu/survey-research/state-state-survey-soss ). Survey results were compiled and analyzed via partnership with the Center for Local, State, and Urban Policy (CLOSUP) at the University of Michigan’s Ford School of Public Policy. A third survey of Michigan municipal treasurers was conducted in early September 2022 in partnership with the Michigan Municipal Treasurers Association.
In general, the vast majority of local officials surveyed are at least somewhat familiar with LFRF (93%), though the proportion of those with detailed programmatic knowledge is much lower (34%). Encouragingly, 43% of Michigan residents surveyed reported at least some familiarity with the program and local officials’ and resident spending priorities largely matched up. Spending for roads, water and sewer infrastructure, and public safety were in the top-four most popular project types for use of LFRF money across both groups.
Figure 1: Percent of Michigan residents rating various types of ARPA funded projects as “very important” (SOSS)
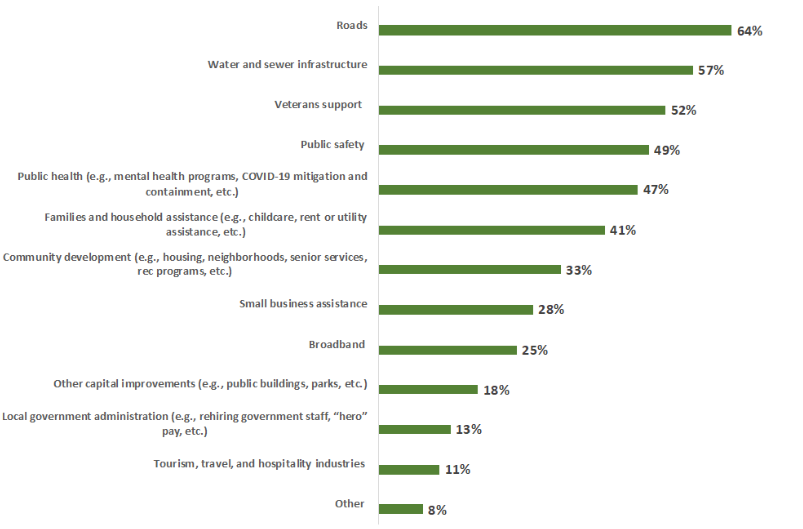
While over half of Michigan local leaders say their jurisdictions are currently planning to use ARPA funding for public buildings, parks, etc., only 18% of Michigan residents statewide say that type of spending is “very important” (see Figure 1). Residents’ list of spending priorities are generally in line with local officials’ ranking of priorities, with roads (64% say very important), water and sewer infrastructure (57%) and public safety (49%) targets. A majority of the general public rates veterans support as a priority (52%), while only 2% of Michigan local governments are currently planning to spend ARPA funding on veterans. Residents also have a strong preference for investment in public health programs (47%) and family and household assistance efforts (41%) whereas these priorities are minimally shared by local leadership at 5% and 2% respectively.
The vast majority of respondents indicated that they [the local unit] are managing “the ARPA program (e.g., compliance reporting, RFP development, identifying other grants to leverage ARPA funds, etc.)” on their own, without a consultant. Only 12% indicated that they had hired or were still considering hiring a consulting firm. Furthermore, 58% of respondents indicated that they already had a “specific ARPA SLFRF spending plan and/or decision-making process for identifying and deciding on ARPA funded projects/areas” in place.
While there is a high level of involvement within government units, however, responses indicate that local units are less concerned with gathering or soliciting input on ARPA spending projects from outside sources, with 34% of respondents indicating that they are “not gathering input”. For those that are soliciting feedback, they are targeting residents, department leaders, contractors, potential grant funders, and others including neighboring local governments.
Both local government officials and Michigan residents say that ARPA funds will help improve infrastructure in their communities, but around a quarter are skeptical of its benefits. Two-thirds (67%) of local leaders statewide expect ARPA funds will somewhat or significantly improve community infrastructure, while 42% of residents say the same (see Figure 2). Meanwhile, similar percentages of officials (26%) and residents (24%) say ARPA funds will either not improve local infrastructure much or at all.
More than half of local leaders think ARPA funding will improve their community’s quality of life (58%) and fiscal health (52%). Michigan residents are less optimistic but are more likely to say there will be beneficial impacts than not.
Few local leaders or residents expect significant improvements in any of these areas, and around a quarter of Michigan residents say they don’t know whether there will be local improvements because of ARPA funding or not.
Figure 2: Local leaders’ expectations of the impacts of ARPA (MPPS) compared with Michigan residents’ expectations (SOSS)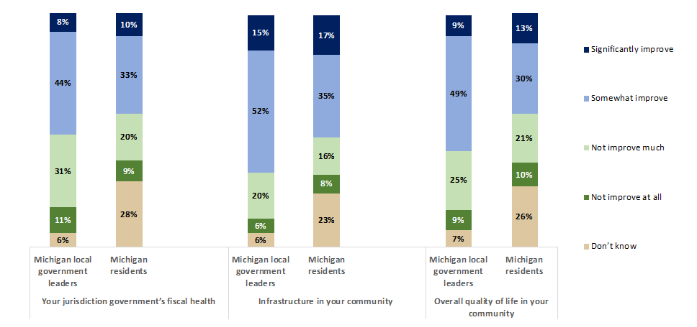
[Note: Figure 2 excludes local officials who say they did not apply for or accept ARPA funding, or are completely unfamiliar with the program.]
Residents’ and local leaders’ relative expectations for community improvement track across many of the regions. However, residents in the northern lower peninsula were more optimistic than their local leadership counterparts that the ARPA funds would help improve their community’s fiscal health.
ARPA Spending in Brief
When it comes to actual spending, 656 Michigan local governments reported a total of 1,328 unique projects utilizing ARPA funds as of the end of March 2022. Most projects were in the category of revenue replacement (72%), followed by negative economic impacts (11%). This is a marked change from the initial January reports, where only 35% of obligated funds were to revenue replacement, and 18% to negative economic impacts. This is likely due to a much larger reporting sample in addition to the Treasury’s Final Rule which allows much greater flexibility to take a standard allowance for revenue replacement rather than calculating actual revenue loss.
Of these projects identified in the project and expenditure reports, 89% of them already have funds set aside (or obligated) for project completion, and spending has already occurred for 71% of these projects. The remaining 11% are named projects with descriptions, but with no indication of potential spend assigned. Table 1 and Figure 3 include a summary of these results. These obligated funds (total obligated to date of $755 million) account for just over 17% (with 8% expended) of Michigan’s $4.4 billion in grant funding. This is in contrast to results from the first round of reporting that showed only 8% of the fiscal recovery funds had been obligated.
Table 1: Summary of ARPA LFRF Fund Usage, All Units, By Expenditure Category
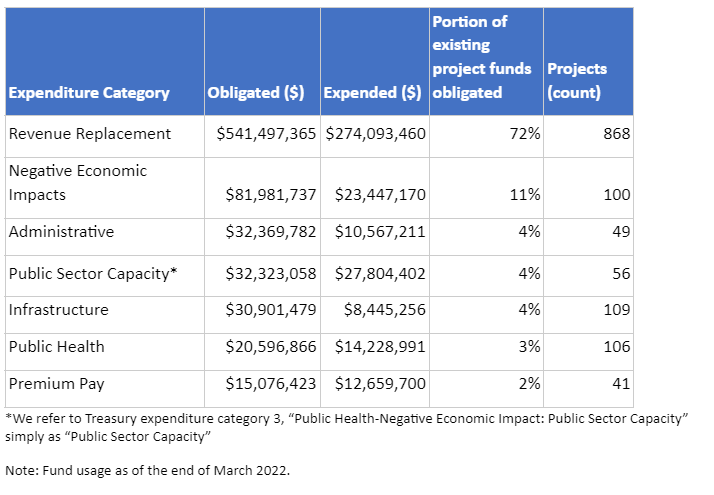
Figure 3: Proportion of ARPA LFRF Funds Obligated By Spend Category
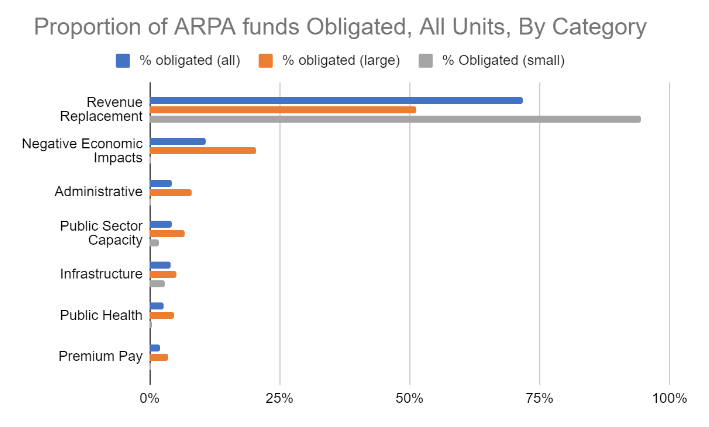
Revenue replacement remains the broadest spend category, with project descriptions including improvements to parks, public health and safety services (like police and fire), broadband projects and equipment, and those that calculated revenue loss. The vast majority of these projects ($540 million) have been obligated for provision of government services (a subcategory of revenue replacement).
For many units, taking the standard allowance means allocating all LFRF money to revenue replacement, the most flexible category from a reporting standpoint under the final rule. Notably, revenue replacement is the only project category to which projects were assigned by the majority of smaller local governments. Over a third ($358 million) of their funds have been obligated to date, and of these, 94% have been assigned to revenue replacement. The sum of all other project obligations across all categories only totaled $20 million. $642 million in funds remain unobligated across these smaller local units, however.
As of March 2022, the 64 largest recipients of LFR funds have both obligated and expended more of their funds (just under $400 million, or 12% of the $3.4 billion they were to receive, compared to January’s $218 million). As of the first quarter 2022 reporting, even for the largest local units, over 50% of obligated funds have been assigned to the revenue replacement expenditure category. However, funds obligated to revenue replacement still only make up 6% of the $3.4 billion large units received from the Treasury.
After revenue replacement, the next two largest shares were dedicated to premium pay for public sector employees and administrative expenses including hiring external consultants for their assistance with the management and reporting of LFR funds. The early timing of these categories of spending is not surprising. Identifying and moving through the political and budget processes new project spending would likely require a longer time frame and additional administrative effort.
For other Treasury spend categories, project descriptions remain broad. Table 2 includes a list of selected projects directly from the required P&E reports.
Table 2: Selected Projects from April 2022 ARPA LFRF Project and Expenditure Reports
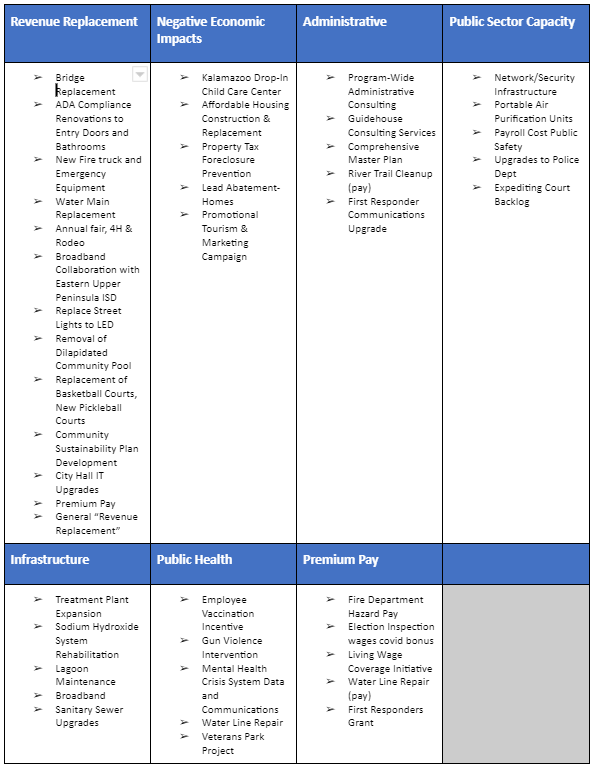
As shown in Table 2 projects reported range from premium and payroll pay for government and related workers to water and sewer updates and maintenance and funding for initiatives (new and old), involving gun violence intervention, mental health systems, and childcare.
The analysis in this report provides a breakdown of spending categories by local government size. All units favored revenue replacement, although small governments were much more likely to obligate all funds (thus far) into this category. Given the ease of electing the standard allowance and the relatively limited resources of smaller units, this is unlikely to change going forward.
Even with changes in the Final Rule that should make project planning and spending easier, there are still many units who have yet to obligate funds to specific projects and government services. Heading into the early months of 2022 many local units, especially those local governments with populations under 50,000 and limited administrative resources, continued to face challenges related to planning and executing expenditures and meeting reporting requirements. Just over 17% of the $4.4 billion in Coronavirus Fiscal Recovery funds allocated to Michigan local governments have been obligated since program rollout in 2021. As expected, obligations have increased since January 2022 when they were only 8%. Nearly $3.6 billion funds remain unobligated, $3 billion to be spent by the 64 large Michigan local governments, while $642 million is to be spent by the remaining 1700+ smaller Michigan local governments. Current project trends give us some idea of where the remaining funds may go, such as into the broad and administratively simple revenue replacement category.
Understanding fund usage and identifying these challenges in implementing the LFRF may be useful to policy makers or advocates interested in utilizing programs like this in the future, either as a counter-cyclical tool for economic stimulus or as a structured, long-term program like the general revenue sharing program of the 1970s-80s. The progress of the program and the challenges revealed throughout its implementation raise interesting questions for some form of more permanent federal general revenue sharing program to support and enhance the health, wellbeing and safety of Michigan's residents.