How Much Debt Is Too Much?
States and municipalities, most of which cannot run chronic deficits like the Federal Government due to state constitutional, statutory and charter prohibitions, must make hard choices if debt becomes burdensome.

Secretary of the Treasury Janet Yellen before the Senate Banking Committee on March 24, 2021
Senator Richard Shelby of Alabama: "Secretary Yellen, in 2017 when you were Chair of the Federal Reserve, you noted that it was concerning to you that the U.S. debt-to-GDP ratio was about 75 percent at that time. Today, the Congressional Budget Office projects debt to reach 102 percent of GDP at the end of 2021. Is the nation’s growing debt something to be concerned about? …"
Secretary Yellen: "… In fact, interest payments on that debt relative to GDP have not gone up at all. I think that’s a more meaningful metric of the burden of the debt on society and on the federal finances. I do believe that we have more fiscal space …"
How much debt is too much? To answer that question, Senator Shelby inquired about the debt-to-GDP ratio—the balance of borrowed money relative to the size of U.S. economic output. Secretary Yellen responded that her preferred measure, interest payments-to-GDP, showed the debt was more affordable than debt-to-GDP would indicate. So how much debt is too much? The question is simple, the answer is not. In part the difficulty is illustrated by the excerpt above—the fact that there is more than one way to measure indebtedness. If the question is difficult to answer for countries, it is even more difficult for states and municipalities. For states and municipalities, there are even more metrics, and the answer to the question at hand is even more important. States and municipalities, most of which cannot run chronic deficits like the Federal Government due to state constitutional, statutory and charter prohibitions,[i] must make hard choices if debt becomes burdensome.[ii]
Herein is a discussion about how to measure indebtedness. A bunch of debt metrics are detailed here and will be reduced to handful for state and local elected officials and public administrators to use. But before those metrics are tended to one must further consider the question “How much debt is too much?” In that question are two questions. First, “Is a governments’ debt affordable relative to its size and projected revenues?” Second, does debt service—principal and interest payments—threaten annual operations or inhibit the ability to make investments in the short-term. The distinction is temporal. How much debt is too much relative to annual revenues, and how much debt is too much relative to the assets the entity will accrue in the future?
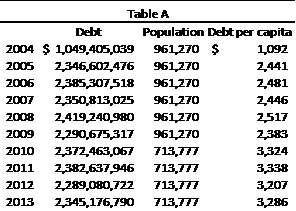
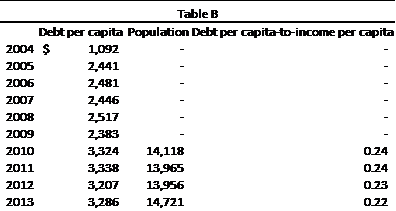
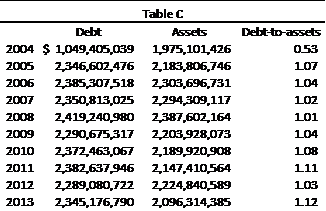
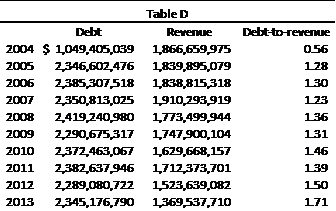
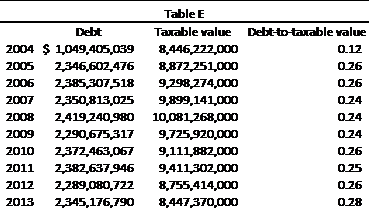
Below common debt metrics are listed. Each metric is described, then, for illustrative purposes, metrics are calculated with City of Detroit financial data used as inputs.[iii] Data is drawn from FY 2004–FY 2013—10 years up to the City’s bankruptcy.[iv]
A brief aside: Debt is often used as a synonym for liability. But while all debts are liabilities, not all liabilities are debts. In this note, debt refers to bonds, notes payable, loans and other non-derivative financial instruments. Debt does not refer to liabilities related to payouts to employees, pensions, other-post-employment benefits, etc.
Debt per capita = debt ÷ population. This ratio measures the debt burden placed on the population supporting the debt.
Debt per capita-to-income per capita = debt per capita ÷ income per capita. This ratio reflects the economic health of a jurisdiction’s population—income levels—relative to debt.
Debt-to-assets[v] = debt ÷ assets. This ratio compares a government’s debt to the assets at its disposal.
Debt-to-revenue = debt ÷ revenue. This ratio reflects the government’s revenues from which debt will be paid relative to how much debt there is to pay.
Debt-to-taxable value = debt ÷ taxable value. This ratio measures debt relative to the property tax base, which generates the tax revenues that are the main source of repayment.
Debt service-to-revenue = debt service ÷ revenue. This ratio reflects the proportion of annual revenues that must be dedicated to debt service.

Debt service-to-net operating income[vi] = debt service ÷ net operating income. This ratio reflects a government’s ability to pay its debts from operating revenues after paying for operating expenses.

Ten-year payout ratio = principal paid over ten years ÷ debt principal. This ratio reflects the amortization of the government’s outstanding debt.

How much debt is too much? As shown above, there are several indicators that would have warned interested parties that the City had too much debt, and others that did not indicate trouble ahead. But Detroit is a case study. More empirical work into insolvencies is needed. In any case, to answer the central question one must choose metrics that answer two others. There should be a metric that illustrates how much debt is owed relative to the size of operations and another that illustrates how much principal and interest payments consume of current resources. (Preferred metrics are the debt-to-revenue metric, which captures the size of operations, and the debt service-to-revenue metric, which captures the burden on current resources).
So, to answer the question at hand: it depends how one measures debt.
[i] C-Span. 2021. “Treasury Secretary and Federal Reserve Chair Testimony on COVID-19 Economic Recovery.”
[ii] Poterba, James M. 1995. “Balanced Budget Rules and Fiscal Policy: Evidence from the States.”
[iii] Morrison, Fred L. 2002. “The Insolvency of Public Entities in the United States.”
[iv] Bomey, Nathan and Gallagher, John. 2013. “How Detroit went broke: The answers may surprise you — and don't blame Coleman Young.”
[v] Data obtained from the government-wide financial statements’ tally of total assets related to governmental activities (net pension assets excluded).
[vi] Fund financial statements are prepared on the modified-accrual basis of accounting. “Net operating income” as it is understood in the context of private businesses or enterprise funds is not accounted for. Here a line from the Governmental Funds - Statement of Revenues, Expenditures, and Changes in Fund Balance is used as a substitute for net operating income. The substitute is the Excess/(Deficiency) of Revenues Over Expenditures line.


 Print
Print Email
Email


