Print
Print Email
EmailMarket Report
I know a lot of corn and soybean producers are disappointed with their yields relative to expectations before plantings, but how producers managed their way through this ugly growing season across the country to get the yields they did was impressive to say the least. Yes, the genetic improvements may have allowed it, but producers made it happen.
CORN
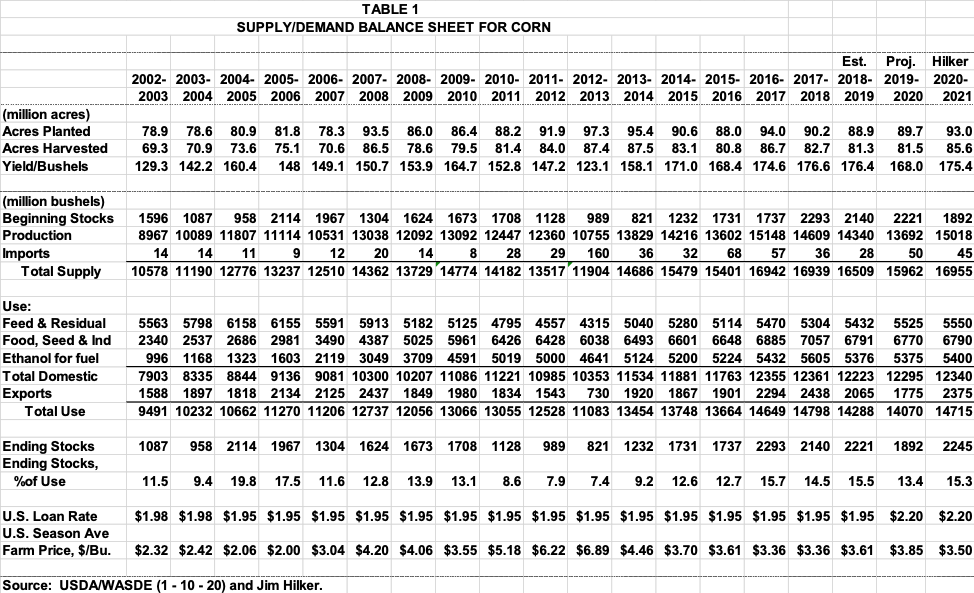
On January 10, 2020 the USDA/NASS Crop Production 2019 Summary was released. It showed the U.S. corn yield at 168 bu/ac, up one bushel from the November farmer survey, but near expectations and did not shock the market. While this is about 5.5 bushels below trend, it is considerably higher than most would have expected given the growing season conditions. On the other hand, every monthly crop production survey from August through December has been the same story, a better corn crop than one would expect.
The final 2019 corn planted acres came in at 89.7 million, down 200,000 from the previous projection, and up 800,000 from 2018. The final 2019 corn harvested for grain acres came in at 81.5 million, down 300,000 from the previous projection, and up 200,000 from 2018. Well you may ask, what about prevented planted corn acres? It turns out that in net for the country, all the corn and soybean prevented plantings came out of soybean acreage, or in other words, acres that would have been planted to soybeans were planted to corn for the country as a whole.
This put total U.S. 2019 corn production at 13,692 million bushels, up 31 million bushels from the November projection, but down 649 million from 2018, 4.5%. Production was also lowered 80 million bushels for 2018 on further analysis, but due to some use changes discussed below, 2018-19 ending stocks, which are also 2019-20 beginning stocks, were increased 106 million bushels. This lead to 2019-20 total supply being higher as we brought more corn into 2019-20 than previously thought.
Michigan was one of the harder hit states as we know. Planted acreage was 2 million acres, down 250,000 from the previous two years. And harvested for grain acres was 1.61 million acres, down 280,000 from the previous two years. Michigan’s yield was put 149 bu/ac, down 4 bushels from 2019, but down over 10 from trend. Michigan is one of several states where producers who reported unharvested acres in the December survey will be resurveyed this spring.
On the use side of the equation, there were significant changes in projections for 2019-20, but the bottom line, ending stocks, was about the same as the December projection. Corn used for feed and residual was increased 250 million bushels for 2019-20, and lowered 186 million for 2018, which matches up much closer with total animal units in both years. But it also showed that more corn was left for 2019-20 as discussed above. Projections for food use was lowered 20 million bushels and for exports were lowered 75 million acres.
Bottom line, 2019-20 ending stocks are expected to be down 328 million bushels from 2018-19, and the stocks to use ratio down from 15.5% to 13.4%. This explains the projected average weighted marketing year price of $3.85 for 2019-20 versus the $3.61 for the previous year. Check out Table 1 for all the numbers and next year’s Hilker projections.
The above analysis matches up pretty well with what the futures market is projecting. Do to the lower production in Michigan, the corn basis is likely to remain strong. The futures market suggest in will pay famers for on farm storage, and while that may be true country wide, we have a different story in much of Michigan. Look at the basis and forward contracts being offered across Michigan, and it indicate the market wants the physical corn now. If you want to bet on the market, consider basis contacts, or sell cash and by futures or calls. Watch the both the nearby and out month basis being offered for further information.
WHEAT
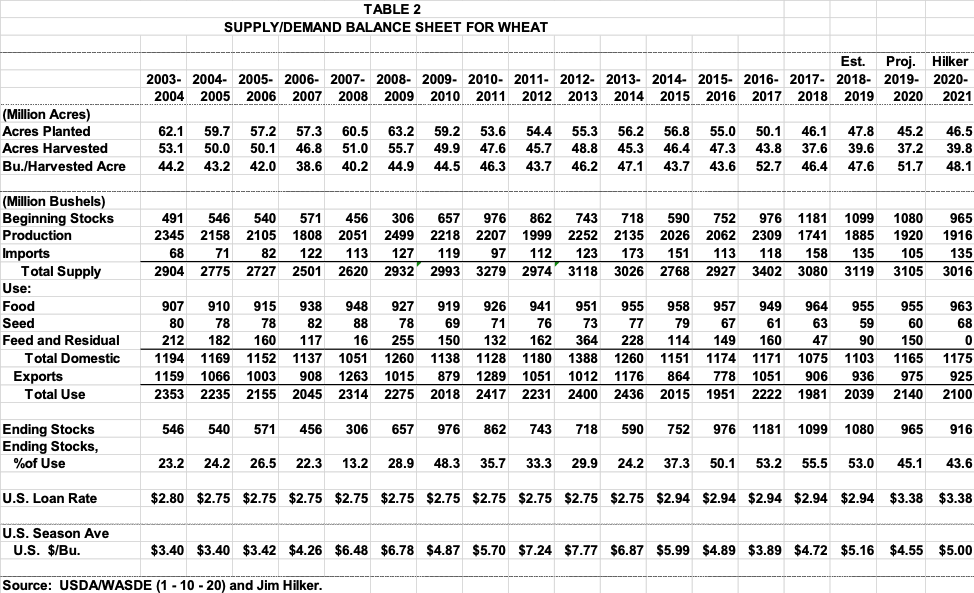
Neither the Annual Crop Report nor the updated January Supply/Demand Report showed hardly any changes for wheat, which isn’t a surprise as none were really expected. The Average Marketing Year price for corn is expected to average $4.55/bu. This is an important reason producers should be choosing the Price Loss Coverage for wheat versus the ARC County option for the 2019 and 2020 decision. And as you can see in Table 2 below I am projecting $5.00/bu in 2020. The Reference price for wheat is $5.50, so both years are in the money. DON’T just pick what you choose in 2014.
SOYBEANS
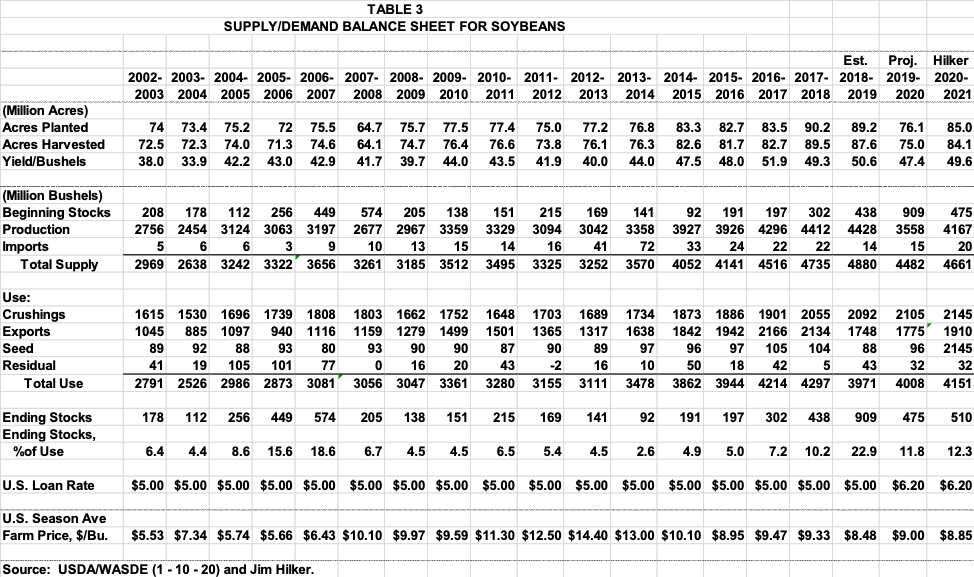
The annual report showed 2019 U.S. soybean planted acres at 76.1 million bushels, 400,000 less than the previous projection, and 13.1 million, 14.7%, less acres than were planted in 2018. The 13.1 million acres is basically all corn and soybean prevented plantings. Harvested acres were down 600,000 from the November projection, and 12.6 million from last year. The 2019 U.S. soybean yield came in at 47.4 bu/ac, down 3.1 bushels from last year, and down about 1 and a half bushels from trend. This led to total 2019 production of 3558 million bushels, down 870 million, 19.6%, from 2018.
Michigan planted 1,760,000 acres, down 570,000 from 2018. That is down 24.5%! Harvested acres were 1,730,000, down 580,000 acres. The yield was put at 41 bu/acre, down from 47.5 last year, and about 6 below trend. Total production was 70.93 million bushels, down from last’s record production of 109.73 million bushels.
The USDA made basically no changes in January to their updated supply/demand report relative to December. Other than they raised their projection of the 2019-20 Marketing Year Average price to $9.00/bu from $8.85 based on sales to date. This is up from $8.48 last year as the stocks to use ratio is projected to drop from 22.9% in 2018-19 to 11.8%. You can see on Table 3, all of the updated numbers as well as my projections for 2020-21.
Depending on location, forward contacts being offered suggest they may pay a bit for on farm storage. The futures suggest they will pay some, and then the basis being offered in out months are stronger in some areas then today.