Print
Print Email
Email Due to the lapse in Federal funding, the USDA Crop Production 2018 Summary, the USDA Quarterly Stocks Report, and the USDA Winter Wheat and Canola Seedings were released on a delay, from January 12 until February 8. Additionally, the World Agricultural Supply and Demand Estimates report for January 2019 will not be published, but has resumed publication on February 8 — incorporating the results of the above reports.
Better late than never, while there were no huge surprises, there were significant updates with respect to 2018 production, as well as significant differences from expectations for disappearance and wheat seedings. Most of this market report are discussing these updates and most of the updates are for the 2018-19 crop marketing year, the middle column of the three tables. However, the changes through ending stocks affect 2019-20 which I discussed a month ago, as well as the winter wheat seedings.
Corn
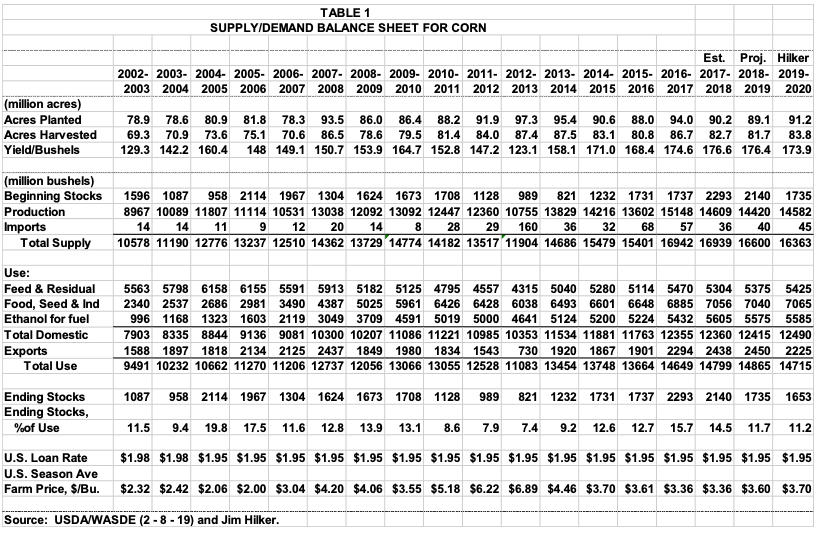
USDA/NASS set 2018 U.S. Corn Production at 14,420 million bushels, which was on the low side of expectations. The average U.S. corn yields was 176.4 bu/ac, down 2.5 bu/ac from the November estimate, and 0.2 bu/acre below the record 2017 corn yield. There were no significant changes in the 2018 planted and harvested acres from the November estimates, and both were a million acres lower than in 2017, at 89.1 and 81.7 million acres.
Michigan’s 2018 corn production was 296.820 million bushels, down 4 million from last 2017. Michigan’s average 2018 corn yield was 153 bu/ac, down 12 bu/ac from the November estimate, down 6 bu/ac from 2017, and 9 bu below the record set in 2015. Acres planted were up 50,000 acres from 2017 for both planted and harvested acres, at 2.3 and 1.94 million acres respectively.
On the use side, projected 2018-19 feed use was lowered 125 million bushels due the quarterly stocks report showing less corn disappearance than expected after being adjusted for the lower than expected crop. This indicates mostly a lower feeding rate, along with slightly lower meat production than previously expected over the period. FSI use is lowered 40 million bushels, reflecting reductions to corn used for ethanol and other industrial use. For ethanol, the reduction is based on the most recent data, and other FSI use is lowered 15 million bushels with lower projections for high fructose corn syrup and glucose and dextrose given production to date and projections. Export projections were left unchanged from the December projection.
The end result was projected 2018-19 ending stocks being lowered 46 million bushels, 211 million less bushels of supply and 165 million less bushels of use, but at a still relatively high 1,735 million bushels, and 11.7 % of use. However, it is certainly an improvement over the 2017-18 numbers which put stocks to use at 14.5% and ending stocks of 2,140 million bushels. The average annual weighted price for 2018-19 is expected to be $3.60, versus the past two years being $3.36/bu. The numbers can all be seen in Table 1 below.
Wheat
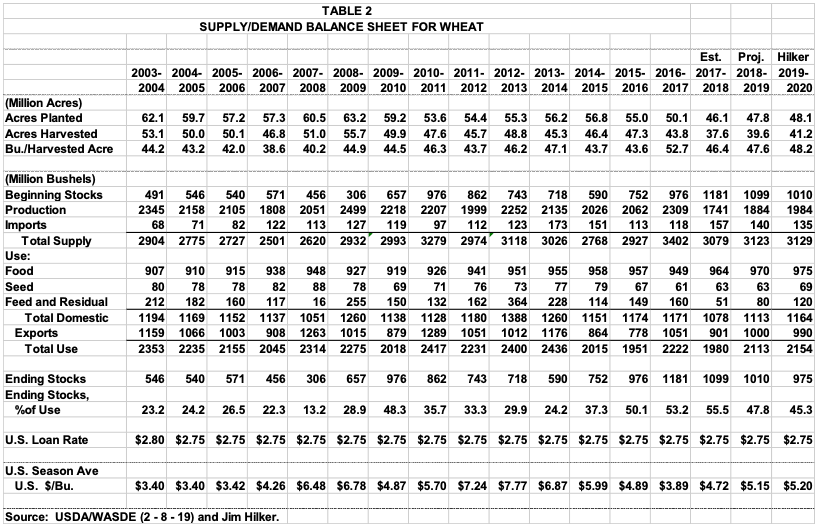
The USDA left the 2018 Annual Wheat Production unchanged from the September release of the Small Grains Summary. You can see the numbers in the middle column of Table 2 below for 2018-19. However, a few changes were made to the 2018-19 use numbers. Feed and residual use is lowered 30 million bushels on larger than expected second-quarter stocks reported in the NASS Grain Stocks report. Seed use is down 6 million bushels reflecting 2019/20 winter wheat planted area released in the NASS Winter Wheat and Canola Seedings report. Projected exports were left unchanged.
This led to a 36 million bushels increase in projected ending stocks. Ending stocks are projected to be 1,010 million bushels, down 89 million from last year. This puts the stocks to use ratio at 47.8%, down from last year’s 55.5%. This put the annual price projection at $5.15 for all wheats, relative to $4.72 for 2017-18.
Winter wheat planted for 2019 was estimated at 31.3 million acres, down 4 percent from 2018. This was the second lowest on record, with the data going back to 1909, and the lowest was an odd circumstance pre 1919. The expectations were for about the about same as last year, but due to excessive moisture and cool weather, the planting window was short.
Hard Red Winter (HRW) wheat seeded area is expected to total 22.2 million acres, down 3 percent from 2018. Soft Red Winter (SRW) wheat seeded area totals 5.66 million acres, down 7 percent from last year. White Winter wheat see ded area totals 3.44 million acres, down 3 percent from 2018. Winter durum wheat seeding were down 21%. Michigan planted 500,000 acres of winter wheat. This was down 10,000 acres from last year, but up 20,000 acres from two years ago.
Due to these updated numbers I lowered my 2019-20 planted acre estimate seen in Table 2 by 2.5 million acres. Over a million less due to the decrease in winter wheat planted, and the remainder in lower expectations for increases in spring and durum wheat planting. This will likely lower ending stocks, and help prices. Although the market as not indicated that to date. Much will depend on the rest of the world’s crop.
Soybeans
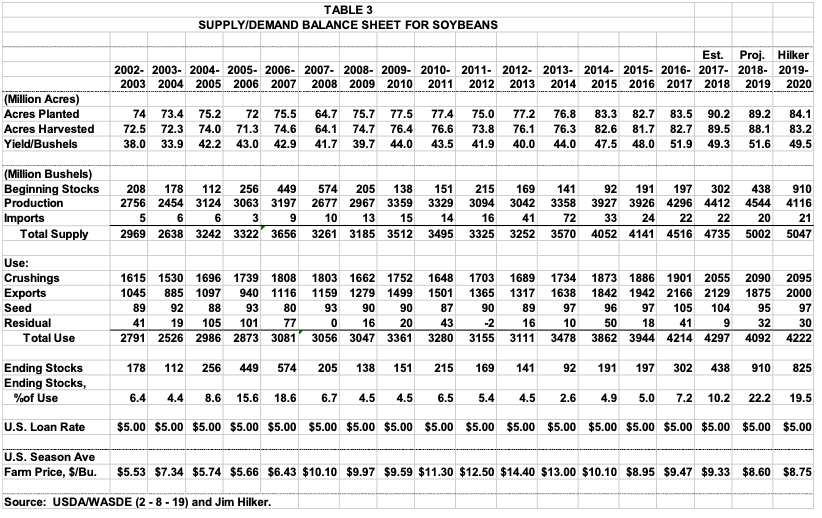
U.S. soybean production for 2018 was a record 4,544 million bushels, up 132 million bushels from last year’s record. However, it was down 56 million from the November projection, although near expectations. The U.S. average yield was 51.6 bu/ac, down a half bushel from the November estimate, but up 2.3 bushels from last year. It will now go down as the second highest yield on record, just below 2016’s 51.9 bu/ac.
At 89.2 million planted 2018 acres were lowered 100,000 acres relative to the previous projection, and were a million acres less than 2017. Harvested acres were put at 88.1, down 200,000 from the November estimate, and 1.4 million from last year.
Michigan’s 2018 soybean production was record 109.44 million bushels, beating out 2016 by 5.4 million. Michigan’s 2018 yield was 48 bu/ac, up from 42.5 last year, but below the 2016 record yield of 50.5 bu/ac. Michigan planted a record 2.3 million and harvested a record 2.28 million acres in 2018, both up 20,000 acres from 2017.
The USDA supply/demand update increased projected crush 10 million bushels due to production to date and indications of more of the same. Projected exports were lowered another 25 million bushels, now about 250 million below last year. Exports may have been lowered more, but the 2018-19 Brazilian soybean crop projection was lowered 5 MMT due to various issues. In net this lowered total use 15 million bushels.
Ending stocks were lowered 45 million bushels as the projected supply decrease was more the use decrease. This still put ending stocks at 910 million bushels, a whopping 22.2% of use, the highest stocks to use ratio since 1985. The annual average price is expected to be $8.70, down from last year’s $9.33.