Commentary: Energy use, GHG and blue water impacts if US diet aligns with new USDA dietary recommend
 Print
Print Email
EmailCRFS Senior Fellow Mike Hamm uses a case study to show why a broad range of multi-disciplinary researchers should be consulted when studying the environmental implications of dietary choices.
The following was originally posted on the website of the Food Climate Research Network on January 25, 2016.
This contribution to the FCRN blog series comes from FCRN member Professor Michael W. Hamm: Senior Fellow, at the Center for Regional Food Systems- Michigan State University.
Mike’s piece provides a short commentary on a paper featured and discussed previously by the FCRN. Full citation for the paper is as follows (Tom, M, Fischbeck, P.S., and Hendrickson, C.T. (2015) “Energy use, blue water footprint, and greenhouse gas emissions for current food consumption patterns and dietary recommendations in the US(link is external)” Environ Syst Decis, DOI 10.1007/s10669-015-9577-y)
For other blogs Mike has written for the FCRN see: Feeding cities - with indoor vertical farms?, the 3 part blog-series on City region food systemsand lastly, his post about the inclusion of sustainability considerations in the US dietary guidelines report.
I think it is important to remember – people eat meals and snacks. We eat food in patterns based on many factors. Unless eating from vitamin tablets and protein powder we eat servings of different foods and collectively they make up our dietary pattern. Unfortunately, I think the Tom et al article(link is external) (reported at FCRN in a nice summary and then expanded upon by Michelle Tom) forgets (or ignores) this very simple truism and seeks to simplify the analysis of dietary patterns to a cross-comparison based on calories. It illustrates the flaws in not having broad, multi-disciplinary researchers engaged in projects of this type (it appears that none of the authors have a background in human nutrition/public health nutrition or in sustainable agriculture, nor was anyone with those credentials thanked in their notes). It is a good case study of the flaws inherent in trying to simplify dietary patterns into a single denominator (in this case calories) for the sake of analysis – and then using that to compare across parts of our dietary plate and create memorable quotes.
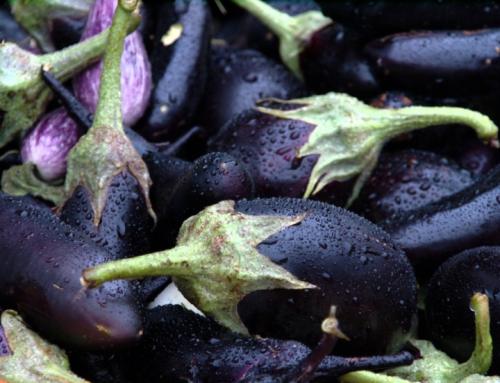
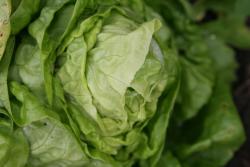 To wit, in their institutional press release(link is external), Paul Fishbeck was quoted “Eating lettuce is over three times worse in greenhouse gas emissions than eating bacon,” while the lead author, Michelle Tom said “Lots of common vegetables require more resources per calorie than you would think. Eggplant, celery and cucumbers look particularly bad when compared to pork or chicken.” and “What is good for us health-wise isn’t always what’s best for the environment. That’s important for public officials to know and for them to be cognizant of these tradeoffs as they develop or continue to develop dietary guidelines in the future.” Pithily, I have never seen anyone substitute lettuce for pork. My opinion, based on a quick analysis of some of their assumptions, is that while the research is not unreasonable the conclusions they draw are both incomplete and very flawed.
I used their figures for energy and blue water use in the crops quoted above and calculated on a daily recommended consumption basis (using the USDA 2,000 Calorie diet servings from the 2010 Dietary Guidelines(link is external)) rather than a per calorie basis (which is what they used) to check the data cited in their quotes.
On a per recommended daily consumption basis (and assuming all the daily ‘meat’ category came from pork and all the daily ‘other’ or ‘green leafy’ vegetables category came from those quoted in the press release) here is what their data says: cucumbers use about 2.2 times the energy but ½ the blue water of pork; eggplant uses about 2.9 times the energy but 24% of the blue water; celery uses about 21% of the energy and 12% of the blue water; head lettuce uses about 1.8 times the energy but 14% of the blue water; romaine and leaf lettuce use about 1.3 times the energy but 14% of the blue water. In their supplementary materials they don’t list their greenhouse gas (GHG) figures by crop but indicate they used those in the supplementary materials of Heller & Keoleian(link is external). I used those numbers to compare (with pork) the relative GHG emissions of the four vegetables quoted and found that, on a daily recommended servings intake basis, the GHG emissions of cucumbers (15% of pork), eggplant (18.3%), celery (12.6%), and lettuces (6.7%) are all much less than pork. In other words - and using their data but in contradiction to their statements - a switch to more plant based foods in line with USDA guidelines, based on the average serving sizes they recommend, leads to fewer GHG emissions and blue water use for the vegetables they highlight.
 A couple of other minor points. In their supplementary information a table of the calories assumed in each food group are given and identified as taken from the U.S. Dietary Guidelines for 2010. It is useful to note that nowhere in the USDA report are the calorie intakes per food group or sub-group delineated. Rather the dietary guidelines recommend shifts in the number of servings. The authors needed to extrapolate the calories per food group in this research by extrapolation – but it is their extrapolation and heavily dependent on the foods used in the groups (and sub-groups). The outcome for that, especially for fruits and vegetables depends very much on what is consumed. For example, within the red/orange vegetable sub-group carrots have 14 calories/cup while sweet potato has 153. It is not clear in either the paper or supplementary materials exactly how they determined the fruit mix and vegetable mix in their analysis – especially since they only provide a single result for each dietary pattern rather than a range of possibility. Subsequently Dr. Tom indicated in a FCRN blog posting that they did use U.S. standard consumption data – and kept those relative consumptions constant as they modeled recommended diets. In that case their data is probably skewed when looking at recommended diets and/or calories since our current consumption of vegetables by subgroup is also skewed relative to the 2010 Dietary Guidelines.
As we work to link human public health and environmental health within the framework of food it is critical that we consider pathways forward as well as looking at the average reality that currently exists (although looking at the range of realities would probably be more useful). From a human health perspective, the 2015 U.S. Dietary Guidelines Advisory Committee report(link is external) is clear on the current state of science regarding our dietary patterns – eating less red and processed meat, eating more fruits and vegetables, and eating less added sugar among others is a dietary pattern that U.S. consumers should move towards. None of these recommendations are binomial – all or none – but rather ones of emphasis and shift in dietary patterns. Within each of the USDA food groups and sub-groups there is a lot of production science indicating pathways to reducing the environmental footprint (whether energy, water, and/or greenhouse gas emissions) – including that of red meat and dairy production. Beyond what exists now, we can imagine pathways to substituting renewable energy for much of the fossil fuel energy in the system today. There are potential gains in changing production locations as well (as we showed for winter lettuce in Michigan(link is external)) – potentially in the best case scenario distributing production more broadly rather than consolidating it in places like California’s Central Valley. All of these are caveats providing opportunity.
It is unfortunate that Toms et al don’t discuss a greater diversity of options, opportunities or shortcomings in their concluding section. They say nothing about the problems endemic to blue water analysis of crops – using average water use, much of which is very inefficient irrigation, and applying it to the entire crop. Making use of very high efficiency irrigation (e.g. trickle tape) would probably bring the blue water usage numbers way down for fruits and vegetables – but wouldn’t have much impact on animal production since using trickle for grain or pasture production is not feasible.
Given that the primary arena analyzed in their paper that may show higher rates per daily recommended intake (vegetables vs meat) is energy use it would be instructive to delineate where these major sources of energy use are (and why so discordant from GHG release) and how they might be transitioned from fossil fuels (to the extent they are) towards renewable energy (to the extent they are not). No one will capture all of this in a peer reviewed paper but it would be perfectly appropriate to make reference to it in the discussion and/or study limitations.
Overall, there is much to digest in this paper and provides a lot of food for thought – it would have been even more productive if their public comments were more in line with their research.