2022 Seedless Pickling Cucumber Cultivar Trial
DOWNLOADDecember 2, 2022 - Benjamin Phillips and Jenny Schoonmaker, Michigan State University Extension
 Print
Print Email
EmailA pickling cucumber cultivar trial was planted at the Southwest Michigan Research and Extension Center (42.088261, -86.351980, Benton Harbor, Michigan). Bejo (BJ), Nunhems (NU), and Rijk Zwaan (RZ) seed companies donated parthenocarpic (seedless) cultivars for mechanical once-over harvest. Overall trial quality was marginal due to being the first trial on a new research farm with different equipment parameters, task procedures, and responsibilities. Factors affecting trial quality were logged for next year’s trial, and include machine planting, incorporating the entire nitrogen recommendation ahead of planting, and adjusting final plant population to 30 inch row spacings.
Materials and Methods
On 16 June fertilizers and lime were preplant incorporated to achieve 30 lb. N, 20 lb. P2O5, 45 lb. K2O, 1 lb. B, 25 lb. S, and 2000 lb. lime per acre (44 lb. 18-46-0, 90 lb. 25-0-15, 64 lb. 0-0-50, 7 lb. 0-0-0-15B, 28 lb. 0-0-90S) in a field size of 0.3 acre. The soil type was a well-drained Spinks loamy fine sand.
On 23 June, 23 parthenocarpic pickling cucumber cultivars were planted in a completely randomized design with four replications. Seeds were hand-planted into single-row plots. Rows were 18 feet long, 30 inches on-center, with 5 inch in-row spacing. On 10 July, all plots were thinned to approximately 20 plants per row, which resulted in a final plant population of 19,265 plants per acre. This is 10,000 plants per acre short of the target population of 30,000 and was a mistake in the calculations for thinning 30-inch row spacings compared to the 20-inch row spacings used previously for this work. Leaving 31 plants per row would have achieved the proper population.
On 24 June, preemergence herbicides were applied to the surface and watered in with 0.5 inch delivered with overhead irrigation: Curbit (ethalfluralin, 3 pt./ac), Command (clomazone 6.4 fl. oz./ac), Sandea (halsulfuron 0.5 fl. oz./ac), and Select Max (clethodim 9 fl. oz./ac). The field was hand-hoed once on 10 July, and bacterial diseases and downy mildew were managed with standard fungicides and preventive timings. No insecticides were applied.
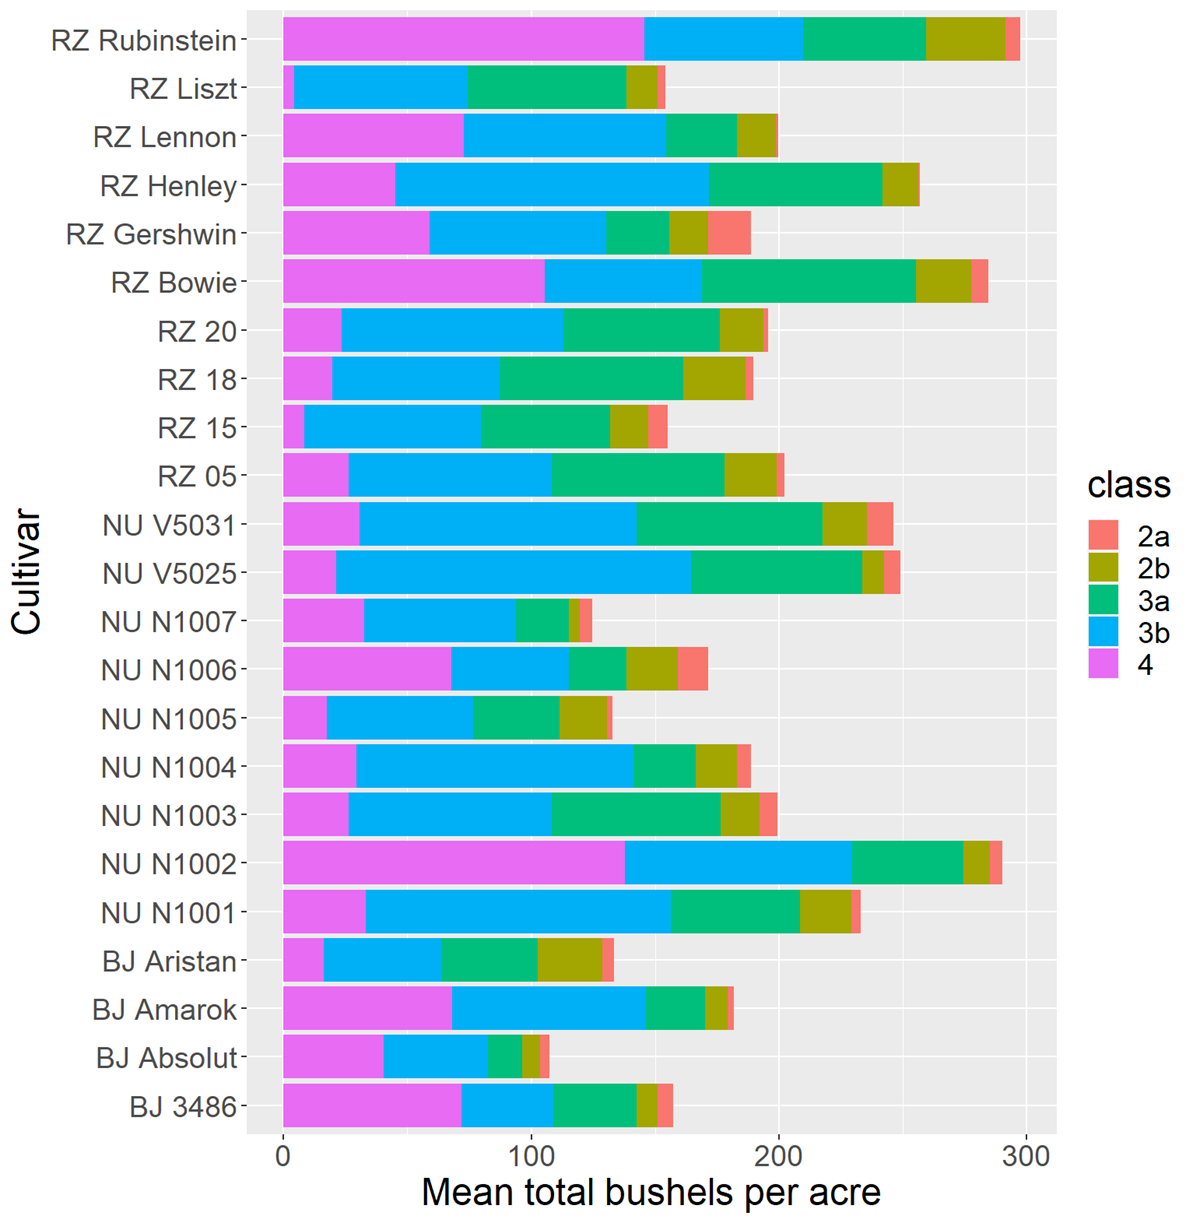
Four reps of all cultivars were harvested and measured between 11-22 August (days 49-60). We harvested all 20 plants from each single row plot when the fruits began reaching advanced sizes. All fruit were removed from the plants and sent through a sorter that separated and weighed them by the following sizes: 2As (1 ⅟16” – 1 ⅟4”, 25 – 65 g), 2Bs (1 ⅟4” – 1 ⅟2”, 66 – 110 g), 3As (1 ⅟2” – 1 ¾”, 111 - 150 g), 3Bs (1 ¾” - 2”, 151 - 210 g), and 4s (> 2”, >210 g). Yield data was analyzed with a non-parametric Kruskal-Wallis procedure followed by a Least Significant Difference (LSD) calculation.
Length:diameter (L:D) ratios, hollow center and monkeyface percentages were measured from ten cucumbers in the 3B size class only, subsampled from a combination of all replications of a cultivar. Hollow centers were counted if a hole larger than ⅟16” could be seen in the center of the seed cavity. A monkeyface was counted if holes larger than ⅟16” could be seen along the outside of the seed cavity. Fruit per plant, bushels per acre of each size class, and combined total bushel per acre yield calculations do not include culls. We determined bushels per acre with the following equation.
Brinestock evaluations took place November 16 and 17. Percent recovery was measured for each cultivar by longitudinally cutting 10 brined 3B pickles and tallying the number of individual fruit that were 100% usable, 90% usable, 70% usable, 50% usable, and 0% usable after running two fingers back and forth one time with medium pressure upon the inside seed cavity. The percent recovery was calculated by dividing the total percentage of usable pickle by the total number of pickles that were evaluated.
Results and Discussion
The season was characterized by warmth and dryness, though the pickle trial only required irrigation in the first two weeks without rain (Table 1). The plant stand was of mixed-age with emergence varying by a few days and resulting in more dominant plants that set fruit while other plants did not. Barren plants could be found in every plot with some individual plots experiencing up to 40% barrenness and averaging 12.9% overall (Table 2). Herbicide injury was not observed, and this could have been affected by soil moisture or planting depth with each seed placed by hand, and four individuals placing seeds. Additionally, a sidedress nitrogen application was never scheduled. As such, yields were low in general, variable across plots, and with few significant differences detected between cultivars (Table 3).
Total clean yield (4 + 3B + 3A + 2B + 2A) averaged 197 bu/a. The top five cultivars with the highest combined clean yields of the most profitable size classes (3B + 3A + 2B) were V5025, Henley, V5031, NUN1001, and RZ05 (Table 3). Of those, only NUN1001 and V5025 had length:diameter (L:D) ratios within 3/16” of a perfect 3.0 in the 3B size class, while the rest were slightly shorter at 2.71 to 2.78. The five lowest yielders overall in total bushels per acre were Liszt, Aristan, NUN1005, NUN1007, and Absolut.
Cull rates averaged 9.5% and were between 0.8% and 19.6% (Table 2). The culls were largely due to crooked and nubbed fruit. The five cultivars with the lowest cull percentages were Liszt, RZ05, NUN1006, V5031, and NUN1005. The five cultivars with the highest cull percentages were RZ18, V5025, Lennon, BJ3486, and NUN1004. Internal defects were not widespread in this trial, but a Rubinstein, Gershwin, Amarok, NUN1006, BJ3486, NUN1005, and Absolut had over 20% of their cut fruit exhibit hollow portions.
Despite not being the highest overall yielders, the most well-rounded cultivars in the field trial were NUN1001, which had the lowest cull percentage and the best L:D ratio within the top five most profitable yielding cultivars, and V5031, which was stubbier in length but had a lower percentage of barren plants.
Total recovery rates averaged 79% (Table 2). Varieties were placed in three different tanks. One of the tanks had explosive head pressure that blew the lid off the tank and three cultivars were unrecoverable. The recovered cultivars were badly misshaped due to the brine tank issue and would not be acceptable as chips or spears, but they were evaluated for internal integrity in the same manner as the other cultivars. The top five cultivars each had Total Percent Recovery scores of either 99% or 100%. When arranged in order of their highest combined clean yields of the most profitable fruit sizes (2B + 3A + 3B), they were RZ 05 (172.7 bu/a), RZ 20 (170.3 bu/a), RZ 18 (166.5 bu/a), RZ Rubinstein (145.5 bu/a), and RZ 15 (138.8 bu/a). Of these top briners, only RZ Rubinstein achieved the average breakeven yield of a 250 total bu/a. When arranged in order of L:D ratio, they were RZ Rubinstein (2.78), RZ 15 (2.77), RZ 20 (2.75), RZ 05 (2.71) and RZ 18 (2.56).
Acknowledgements
Thanks to Kristin Oomen, Grace Kenny, Chris Dyk, Howard Anderson, Robert Grohs, and George Pape at the seed companies; Dave, Rich, Sylvia, Martin, Mina, Ramon, and Jenny at the farm; Dorothy, Ernesto, Diego, and others at Flamm’s Pickle & Packing Company; and Pickle Packers International.
|
Table 1. Weather data summarized by weeks between 23 June and 22 August at the Southwest Michigan Research and Extension Center in 2022. Temperatures were averaged by week, and precipitation is total number of inches received for that week. *Week is reported as week of the year (week of the trial). |
|||||
|
Week* |
Max Air Temp (F) |
Min Air Temp (F) |
Max Soil Temp (F) |
Min Soil Temp (F) |
Precipitation (inches) |
|
25(1) |
80.33 |
59.95 |
88.68 |
72.00 |
0.00 |
|
26(2) |
82.09 |
57.20 |
90.73 |
71.44 |
0.00 |
|
27(3) |
84.50 |
63.96 |
87.79 |
73.20 |
2.65 |
|
28(4) |
79.93 |
60.28 |
85.60 |
72.78 |
0.12 |
|
29(5) |
85.20 |
68.90 |
86.07 |
75.17 |
0.36 |
|
30(6) |
- |
- |
- |
- |
- |
|
31(7) |
84.77 |
70.93 |
84.73 |
76.07 |
0.83 |
|
32(8) |
79.15 |
65.55 |
82.65 |
74.30 |
0.02 |
|
33(9) |
- |
- |
- |
- |
- |
|
Mean |
82.3 |
63.8 |
86.6 |
73.6 |
0.6 |
|
Table 2. Quality data of 23 seedless picking cucumber cultivars planted at the Southwest Michigan Research and Extension Center in 2022. Values are averaged across four replicates. No statistics were performed on quality data. Data in this table are arranged as an extension of Table 3 and are sorted in order of largest total yield in clean bushels per acre (4 + 3B + 3A + 2B + 2A). NU V5031, NU N1001, and RZ Gershwin were lost in the brine tanks and no data was recorded for Total % Recovery for those cultivars. |
||||||||
|
Company and Cultivar |
L:D 3B |
% Hollow |
% Monkey face |
% Cull |
Days after planting |
Harvest population |
% Barren |
Total % Recovery |
|
RZ Rubinstein |
2.8 |
20.0 |
0.0 |
12.9 |
60.0 |
19360 |
5.0 |
99.0% |
|
NU N1002 |
2.6 |
0.0 |
0.0 |
9.8 |
55.3 |
18634 |
5.3 |
85.7% |
|
RZ Bowie |
2.8 |
0.0 |
10.0 |
12.3 |
57.5 |
19360 |
3.8 |
87.0% |
|
RZ Henley |
2.7 |
0.0 |
0.0 |
12.8 |
49.0 |
19118 |
13.8 |
67.0% |
|
NU V5025 |
2.8 |
0.0 |
0.0 |
13.8 |
53.5 |
19360 |
7.5 |
35.0% |
|
NU V5031 |
2.8 |
0.0 |
0.0 |
4.7 |
52.5 |
18876 |
7.6 |
NA |
|
NU N1001 |
3.0 |
0.0 |
0.0 |
6.6 |
54.5 |
19118 |
5.1 |
NA |
|
RZ 05 |
2.7 |
0.0 |
0.0 |
3.1 |
49.0 |
19360 |
21.3 |
100.0% |
|
RZ Lennon |
2.5 |
0.0 |
0.0 |
14.9 |
53.8 |
19360 |
23.8 |
97.0% |
|
NU N1003 |
2.6 |
10.0 |
0.0 |
10.2 |
54.0 |
19602 |
13.6 |
69.0% |
|
RZ 20 |
2.7 |
0.0 |
0.0 |
7.2 |
49.0 |
19360 |
15.0 |
100.0% |
|
RZ 18 |
2.6 |
0.0 |
0.0 |
13.1 |
50.0 |
19360 |
12.5 |
100.0% |
|
RZ Gershwin |
2.9 |
0.0 |
20.0 |
11.4 |
55.0 |
19360 |
2.5 |
NA |
|
NU N1004 |
2.9 |
10.0 |
0.0 |
19.6 |
53.0 |
19360 |
20.0 |
79.0% |
|
BJ Amarok |
2.2 |
10.0 |
20.0 |
9.4 |
53.0 |
19360 |
7.5 |
34.0% |
|
NU N1006 |
2.7 |
12.5 |
37.5 |
3.3 |
55.8 |
19602 |
4.9 |
77.0% |
|
BJ 3486 |
2.7 |
0.0 |
33.3 |
15.1 |
54.8 |
19360 |
18.8 |
99.0% |
|
RZ 15 |
2.8 |
0.0 |
0.0 |
7.7 |
50.0 |
19118 |
21.4 |
99.0% |
|
RZ Liszt |
2.5 |
0.0 |
0.0 |
0.8 |
50.0 |
19360 |
17.5 |
98.0% |
|
BJ Aristan |
2.4 |
0.0 |
0.0 |
9.0 |
54.3 |
19360 |
10.0 |
89.0% |
|
NU N1005 |
2.7 |
0.0 |
40.0 |
4.8 |
56.5 |
18634 |
10.5 |
35.0% |
|
NU N1007 |
2.6 |
12.5 |
0.0 |
6.2 |
52.5 |
19360 |
26.3 |
47.0% |
|
BJ Absolut |
2.5 |
0.0 |
20.0 |
9.2 |
51.0 |
19360 |
23.8 |
88.0% |
|
Mean |
2.7 |
3.3 |
7.9 |
9.5 |
53.2 |
19265.3 |
12.9 |
79.2 |
|
Std.dev |
0.2 |
5.8 |
13.3 |
7.1 |
3.5 |
407.4 |
13.1 |
23.7 |
|
CV |
6.6 |
178.2 |
168.6 |
75.3 |
6.6 |
2.1 |
101.5 |
29.9 |
|
Table 3. Mean yield data of 23 seedless picking cucumber cultivars at the Southwest Michigan Research and Extension Center in 2022. Data in this table are arranged in order of largest mean total yield in clean bushels per acre (4 + 3B + 3A + 2B + 2A), with a bushel representing 48 lb. of pickles. Values in bold indicate the cultivar performed statistically like the cultivar with the highest value for that column. Numbers in parentheses are rank-sum values generated through the Kruskal-Wallis procedure used to analyze data that did not meet the assumptions for performing an ANOVA procedure. The Least Significant Difference (LSD) is the critical value that differentiates cultivars statistically. For example, subtracting the Clean Total bu/a LSD of 33.7 from the rank-sum of Rubenstein – 72 – is 38.3. Any cultivar with a rank-sum less than 38.3 is deemed significantly different from Rubenstein. |
||||||||
|
Company and Variety |
Clean Total bu/a |
Clean 4 bu/a |
Clean 3B bu/a |
Clean 3A bu/a |
Clean 2B bu/a |
Clean 2A bu/a |
Cull bu/a |
Fruit per plant |
|
RZ Rubinstein |
297.3 (72.0) |
145.7 (81.3) |
64.2 (34.3) |
49.4 (53.8) |
32.0 |
6.0 |
37.3 (82.5) |
1.8 |
|
NU N1002 |
290.0 (62.0) |
137.8 (85.8) |
91.9 (31.5) |
44.7 (43.3) |
10.8 |
4.9 |
22.1 (58.3) |
1.7 |
|
RZ Bowie |
284.6 (65.0) |
105.5 (69.5) |
63.5 (38.8) |
86.2 (51.8) |
22.4 |
7.1 |
17.0 (61.6) |
1.9 |
|
RZ Henley |
256.8 (66.8) |
45.0 (55.8) |
126.8 (73.8) |
70.0 (65.0) |
14.5 |
0.5 |
14.3 (48.6) |
1.6 |
|
NU V5025 |
249.0 (60.3) |
21.2 (30.6) |
143.3 (79) |
69.1 (59.0) |
8.9 |
6.6 |
24.0 (72.3) |
1.7 |
|
NU V5031 |
246.1 (72.3) |
30.7 (41.9) |
111.8 (68.0) |
75.1 (71.5) |
17.8 |
10.7 |
8.5 (39.3) |
2.0 |
|
NU N1001 |
233.1 (60.8) |
33.1 (41.9) |
123.1 (70.3) |
52.3 (55.0) |
20.7 |
3.8 |
4.5 (24.5) |
1.6 |
|
RZ 05 |
202.1 (52.8) |
26.4 (36.6) |
81.9 (54.0) |
69.6 (63.8) |
21.2 |
3.0 |
8.8 (39.8) |
1.5 |
|
RZ Lennon |
199.7 (35.5) |
72.7 (60.3) |
81.7 (44.5) |
28.5 (30.3) |
15.9 |
0.8 |
16.6 (51.0) |
1.2 |
|
NU N1003 |
199.2 (53.5) |
26.3 (37.5) |
82.0 (52.8) |
68.2 (65.0) |
15.4 |
7.2 |
14.8 (50.3) |
1.6 |
|
RZ 20 |
195.6 (53.0) |
23.4 (33.3) |
89.4 (61.6) |
63.1 (60.8) |
17.8 |
1.8 |
12.7 (48.8) |
1.4 |
|
RZ 18 |
189.5 (51.5) |
19.8 (31.5) |
67.4 (42.1) |
74.0 (69.0) |
25.1 |
3.1 |
12.8 (52.3) |
1.5 |
|
RZ Gershwin |
188.7 (51.5) |
58.9 (61.4) |
71.3 (46.8) |
25.5 (28.8) |
15.9 |
17.2 |
26.9 (76.1) |
1.5 |
|
NU N1004 |
188.6 (41.8) |
29.4 (42.4) |
111.9 (64.9) |
25.1 (28.0) |
16.7 |
5.5 |
29.4 (76.8) |
1.2 |
|
BJ Amarok |
181.8 (47.5) |
68.2 (67.8) |
78.0 (54.8) |
24.1 (28.1) |
8.9 |
2.6 |
10.6 (44.0) |
1.3 |
|
NU N1006 |
171.4 (41.3) |
67.7 (64.0) |
47.7 (26.3) |
23.2 (25.9) |
20.7 |
12.2 |
3.6 (20.8) |
1.3 |
|
BJ 3486 |
157.4 (32.8) |
71.7 (59.6) |
37.2 (19.1) |
33.5 (31.8) |
8.7 |
6.3 |
31.4 (67.1) |
1.0 |
|
RZ 15 |
155.0 (34.5) |
8.3 (16.8) |
71.5 (42.3) |
52.3 (55.8) |
15.1 |
7.9 |
9.0 (42.0) |
1.2 |
|
RZ Liszt |
154.1 (33.5) |
4.3 (10.5) |
70.1 (45.5) |
64.0 (65.3) |
12.5 |
3.2 |
1.0 (10.4) |
1.3 |
|
BJ Aristan |
133.4 (25.5) |
16.2 (24.9) |
47.6 (23.5) |
38.7 (38.8) |
26.2 |
4.7 |
9.4 (41.6) |
1.2 |
|
NU N1005 |
132.6 (22.0) |
17.4 (28.6) |
59.0 (36.8) |
35.0 (39.3) |
19.1 |
2.2 |
4.0 (21.6) |
1.1 |
|
NU N1007 |
124.5 (21.0) |
32.6 (38.4) |
61.2 (37.4) |
21.3 (23.3) |
4.5 |
4.9 |
2.8 (18.5) |
0.9 |
|
BJ Absolut |
107.31 (13.0) |
40.5 (49) |
41.9 (21.4) |
13.9 (16.8) |
7.2 |
3.8 |
3.7 (21.6) |
0.8 |
|
Mean |
197.3 |
48.0 |
79.3 |
48.1 |
16.4 |
5.5 |
14.1 |
1.4 |
|
CV |
49.3 |
106.8 |
61.0 |
77.3 |
85.6 |
112.3 |
96.4 |
44.2 |
|
Test stat H (22,69) |
35.7 |
48.7 |
36.6 |
36.5 |
25.9 |
30.2 |
51.9 |
28.9 |
|
P-value |
0.033 |
0.001 |
0.026 |
0.027 |
0.254 |
0.114 |
0.000 |
0.147 |
|
LSD (t.students α=0.05) |
(33.7) |
(53.0) |
(33.4) |
(33.5) |
ns |
ns |
(55.8) |
ns |