Print
Print Email
EmailCorn
 How’s planting conditions across the Corn Belt. Are they better than the three days prior to my writing this article? Which had to be the three most miserable days of an April in my entire life? On March 29 USDA/NASS released the results of the 2018 Prospective Plantings report; this is a survey of farmers planting intentions as of early March. It is meant to be a signal to the market, do the planting intentions match up with expected prices/returns, or should changes be made to more actually reflect needs? Actual plantings would also be expected to change if relative prices/returns change by planting time, and of course weather conditions during plantings.
Producers suggested they would plant 88 million acres of corn, about 2 million less than I estimated in my December and January writings, and last year’s plantings, and about 1.3 million less than the average trade estimate leading into the report. More will be said in the soybean section, but soybean plantings were at 89 million were about a million less than last year and my estimates for 2018, and almost 2 million less than the average trade estimate. Where did these acres go? About a million appear to have left cultivation this year, about a million went to increased cotton plantings, and about a million and a half went to increased spring wheat acres.
The downward adjustment in planted corn and soybean acres due to lower returns appears to be happening quicker than I projected; I thought we would see this reduction in 2019. This will speed up the return to economic breakeven prices for the efficient producers, which economics would project as the price in the longer run. What are breakeven corn prices? My best forecast is producers will need to be able to compete with corn prices averaging in the $3.80-4.00 area after some more downward movement in land rents. This would be the “knew” $2.35 we averaged over the 1979-2006 period.
Michigan Farmers suggested they will plant 2.25 million acres of corn for 2018. This would be the same number of acres planted this past year. It would be the third highest on record, along with last year and 2014, behind the 2.7 million planted in 2012 and the 2.6 planted in 2013. However, if Michigan achieved its trend yield of 161.8 bu/acre, and harvested the average 87% of our corn crop for grain, we would achieve a record corn production of 358 million bushels.
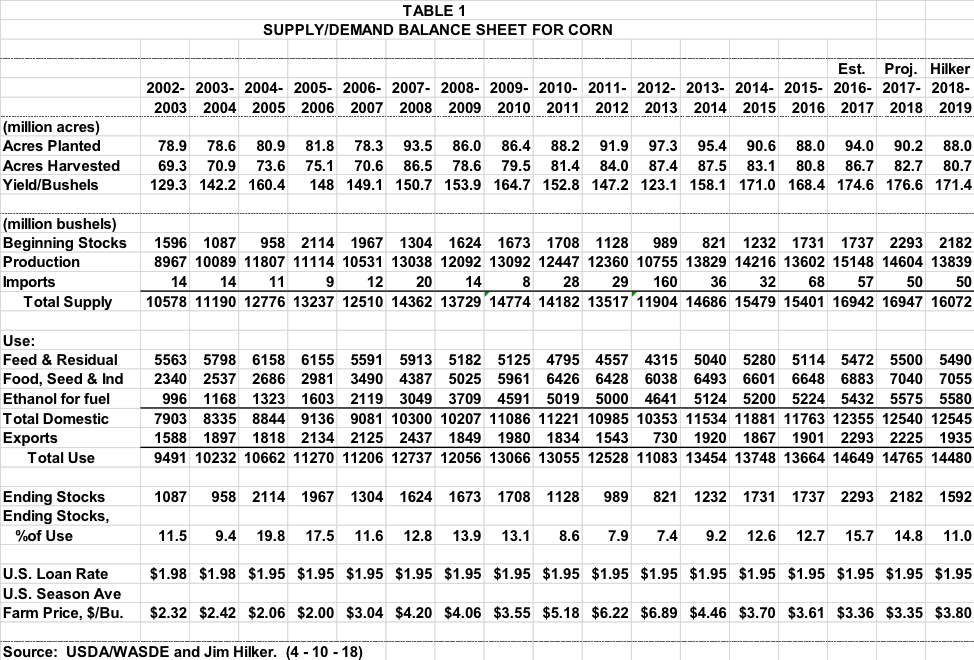
The 88 million of planted corn acres for the U.S. adjusted to planted acres of about 80.7 million acres times a trend yield of 171.4 bu/ac would produce a 3.8 billion bushel corn crop, which would tie it for the 4th largest corn crop on record. As shown in Table 1, use in 2018-19 would be just less than 2017-18 due to higher prices and projected less export demand as Argentina would expect to have a normal corn crop versus this year’s shortfall. This would lower projected 2018-19 ending stocks to 1,592 million bushels relative to 2017-18’s 2,182 million. And ending stocks to use would go from 2017-18’s 14.8% to 11%. This would indicate the annual average price would go from this year’s $3.35 to $3.80; this projection for 2018-19 is in line with new crop bids we are seeing today. Now the weather gets to take over.
Wheat
The 2018 Prospective Plantings Report indicated U.S. wheat producers planted 46.9 million acres of all wheat for 2018 production, 600,000, 3%, more than last year, but still the second lowest planted wheat acreage since record began in 1919.
The 2018 winter wheat planted area, at 32.7 million acres, is up slightly from both last year and the previous estimate. Of this total, about 23.2 million acres are Hard Red Winter, 5.85 million acres are Soft Red Winter, and 3.64 million acres are
White Winter. Area planted to other spring wheat for 2018 is estimated at 12.6 million acres, up 15 percent from 2017. Of this total, about 12.1 million acres are Hard Red Spring wheat. Durum planted area for 2018 is estimated at 2.00 million acres, down 13 percent from the previous year.
Michigan planted 530,000 acres of winter wheat. This is 50,000 more acres than last year, up 10%. But down from two years ago when Michigan planted 610,000 acres. The 530,000 is on the lower side of “normal” for Michigan, with the 610,000 being on the higher side of “normal”, I would call last year’s acreage very low, and was due to both low expected prices and poor planting conditions. At this point there is not a breakdown of how much of the Michigan wheat acres are soft red and how many are soft white. As of April 16 the Crop Progress Report released each Monday showed the winter wheat condition in Michigan as 11% excellent, 57% good, 25% fair, and 7% poor or very poor. These Michigan numbers are fairly normal, maybe a bit higher, for this time of year.
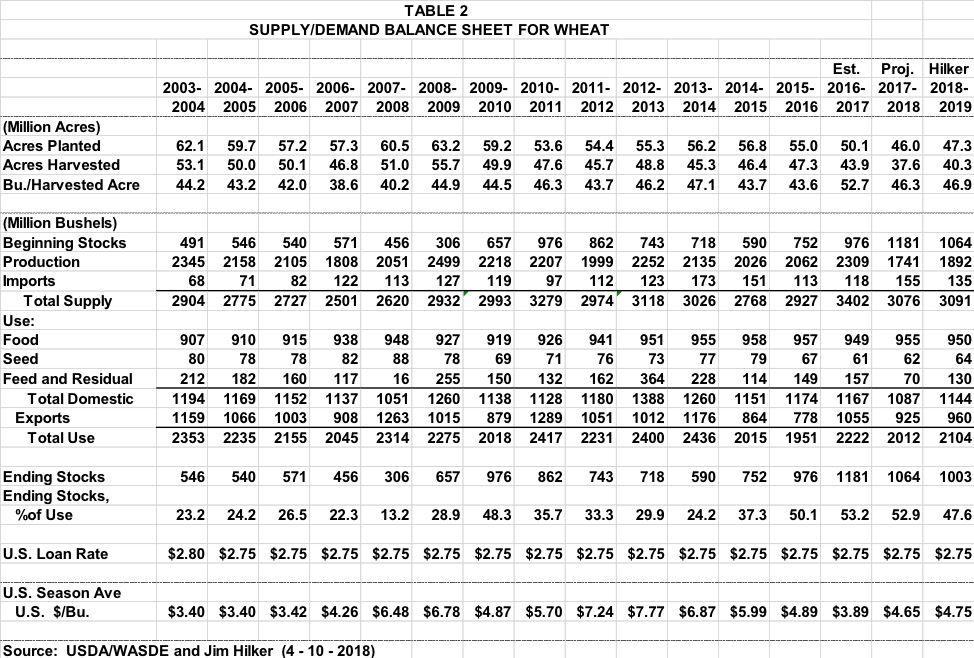
In Table 2 I show my projections for the 2018-19 U.S. wheat marketing year. With 47.3 million acres of wheat planted, and a normal percent of the planted acres harvested, and a trend yield as shown, ending stocks to use would fall a bit and prices would increase a little from last year. However, due to the prolonged drought in the high plains affecting the hard red winter wheat crop, we are unlikely to reach trend yields or the normal percent of harvested acres. The winter wheat crop good and excellent combined were 30%, this compares to last year, when we had good but not record winter wheat yield, of 54% good to excellent at this time of year. And new crop bids reflect the high likelihood of poorer than trend hard red winter wheat yields.
Soybeans
U.S. soybean producers planned on planting 89 million acers of soybeans for 2018 production as of the first part of March when the Prospective Planting Survey information was collected from farmers. This is a little over 1 million less acres than planted in 2017, but will be the second most soybeans planted on record by a large margin, the next highest was in 2016 at 82.7 million. And for the first time we plan on planting more soybeans than corn. And if the planting weather does not improve the different may increase. However, with today’s equipment we can plant a lot of corn in a short period of time, like half of Iowa in a week of great weather.
Michigan intends to plant 2.15 million acres of soybeans. While down 130,000 acres, 6%, from last year’s record Michigan soybean planted acreage, it will still be the second most soybeans planted in Michigan by 80,000 acres. With a normal percent of acres harvested, and a trend yield of 47.2, we would produce our second largest soybean crop. In 2017 we had a disappointing 42.4 bu/ac yield for Michigan as a whole.
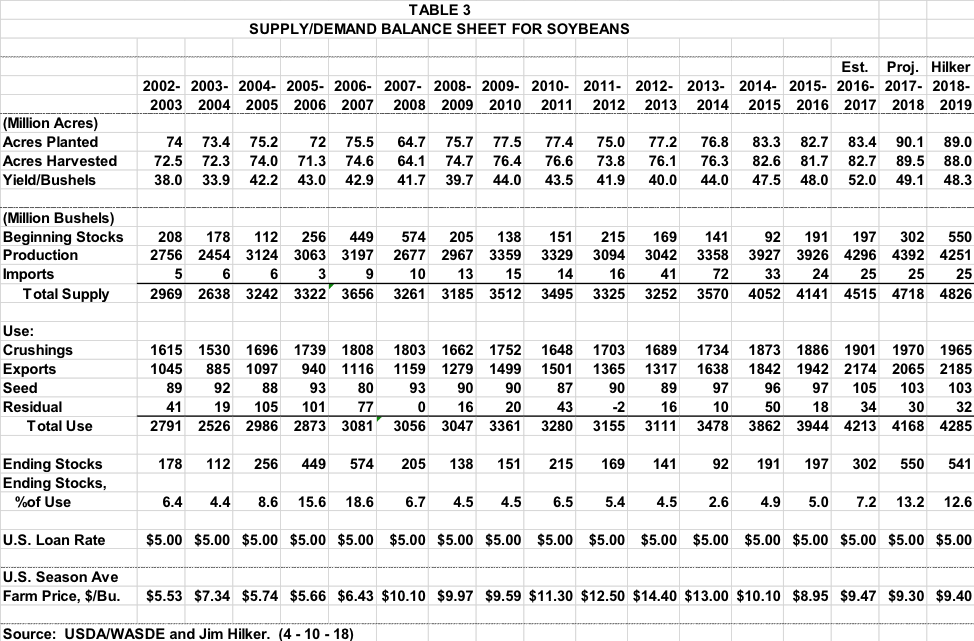
In Table 3, I have my supply/demand forecasts for the 2018-19 soybean marketing year. Using the 89 million acres planted, adjusting to a normal percent of harvested acres, and multiplying by a trend yield of 48.3 bu/ac and we would produce 4,251 million bushels, while less than the past two years, still massive. And when you add the huge projected beginning stocks, total supplies are likely to be a record as shown in Table 3. And even with projected use for 2018-19 growing by over 100 million bushels, projected ending stocks will hardly shrink. Although the bit tighter ending stocks to use should mean an average price a little above a year ago at $9.40/bu.
However, my forecast show on Table 3 in the last column, do not appear to match up with the market. As of this writing we have harvest delivery bids in the high $9.00 range and January bids over $10 per bushel. Does that mean we are seeing new crop soybean bids that suggest some forward pricing, or is my analysis missing a significant issue?