Print
Print Email
EmailMarket Outlook - March 2018
 Corn
Corn
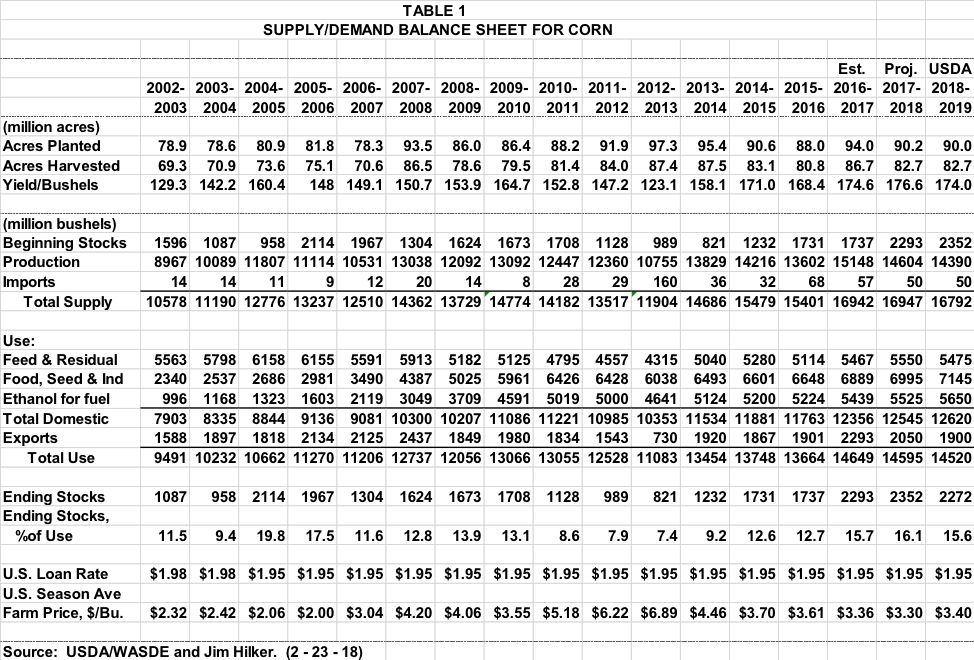
The USDA held their Annual Outlook Forum February 22-23. On February 23rd they released their first 2018-19 Supply/Demand projection. They will begin updating their 2018-19 forecasts monthly beginning in May. The USDA 2018-19 projections are not a lot different than the picture I painted in the December issue, lots of corn and lots left over. The 2018 USDA Prospective Plantings Report will be released March 29, and will be incorporated into the May projections.
The USDA expects the total planted acres of corn, wheat, and soybeans to be 226.5 million acres, up slightly from last year, but only 200,000 acres, less than a half percent. Corn and soybean futures and new crop ash prices are about the same this year as last year, so while returns are not expected to be good, but likely no worse. Spring wheat prices are higher, but winter wheat prices lower when it was planted.
Corn plantings are expected to be 90 million acres, down 200,000 acres from last year, but virtually the same as 2017 intended plantings. Area harvested is expected to be 82.7 million acres, the same as 2017. The USDA is using a weather-adjusted trend yield assuming a normal growing season of 174 bu/ac. Down from last year’s record 176.6 bu/acre, but if it happens, would be the third highest on record. This would put projected production at 14,390 million bushels, down about 215 from last year, but would still the third largest on record.
At 2,353 million bushels, beginning stocks are expected to be about 60 million more than 2017-18, and imports the same 50 million bushels. This would put total supply at a massive 16,792 million bushels, only 155 million, 0.8%, less than the record set the past two years.
The USDA expects corn feed use and residual at 5,475 million bushels to be down 75 million bushels in 2018-19, even with moderate growth in grain consuming animal units. This decline reflects smaller residual disappearance due to a smaller crop, more corn used for ethanol, and slightly higher prices.
The USDA is projecting 2018-19 corn use for ethanol will be up 125 million bushels at 5,650 million bushels, once again jumping ahead of corn for feed. This is mostly based on more miles being driven with continued relaticely low gas prices and modest economic growth. Exports are also expected to grow.
Corn exports are expected to be down 150 million bushels to 1,900 million bushels based on strong competition from South America and the Ukraine. But a continued deterioration in the 2017-18 Argentina corn crop and/or the Brazilian second crop could change that.
This would put total 2018-19 use at 14,520 million bushels, which leaves ending stocks at 2,272 million bushels, 90 million bushels less than 2017-18 projections. But at 15.6% of use it is still at a very burdensome level. This would put the expected average weighted price around $3.40/bu versus the 2017-18 expectation of $3.30. You can see all the numbers in Table 1.
Wheat
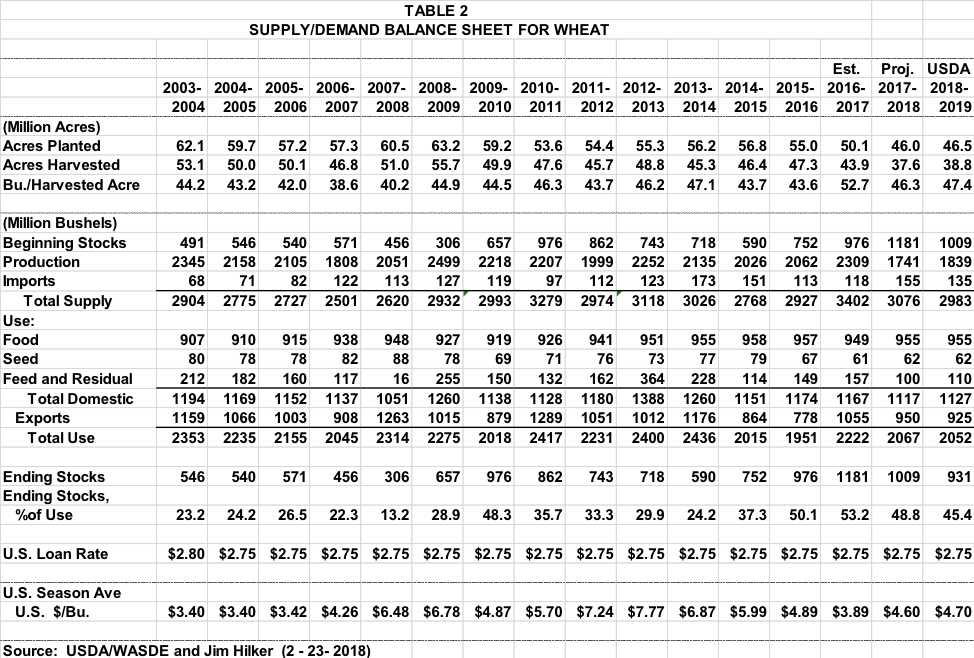
The USDA expects 2018 wheat planted area to be up 0.5 million acres at 46.5 million. Winter wheat plantings were down fractionally based on the winter wheat seeding report released in January, and will be the lowest in 109 years. Hard red winter wheat plantings were down 0.3 million acres and soft red winter was up 0.2 million acres. Winter white was up fractionally. Spring wheat plantings are expected to be up 4% with higher new crop bids than a year ago.
The USDA used a twenty year trend for their projected all wheat yield of 47.4 bu/ac. The all wheat harvested as a percent of planted is expected to be up some from 2017-18, but less than the long term average given the drought affected acres in the southern plains. Harvested acres is expected to be 38.8 million acres.
This would put 2018 wheat production at 1,839 million bushels, up 6% from last year. Which other than last year, the lowest U.S. wheat production since 2002. Total supply is expected to be down 93 million bushels as the higher production is more than offset by the lower beginning stocks, down 172 million bushels, and the slightly lower expected imports. The 3% decrease in expected total supply, 2,983 million bushels, is meaningful below the five year average of 3,040 million bushels.
Domestic wheat use is expected to be about the same as a year ago, up 10 million bushels based on a slight increase in feed and residual. Food and seed use are expected to remain at 2017-18 levels for the 2018-19 wheat marketing year.
Wheat exports are expected to be down 25 million bushels, 2.6%, at 925 million bushels. This is due to lower supplies, higher prices, and continued strong international competition. The European Union is expected to have a larger crop and Australia and Canada are expected to rebound from their 2017-18 yields. And while Russia is not expected to repeat their record crop, they will have plenty to export as their carry in will be large.
This puts 2018-19 total use at 2,052 million bushels, down 15 million compared to 2017-18. Ending stocks are expected to be down 8% at 931 million, but still above the 5 year average of 902 million. And the projected stocks to use ratio of 45.4%, is lower as well, but again, higher than the 5 year average of 42.7%. The average expected 2018-19 all wheat price is expected to be $4.70 per bushels, up 10 cents. Checkx out Table 2 for all the numbers.
Soybeans
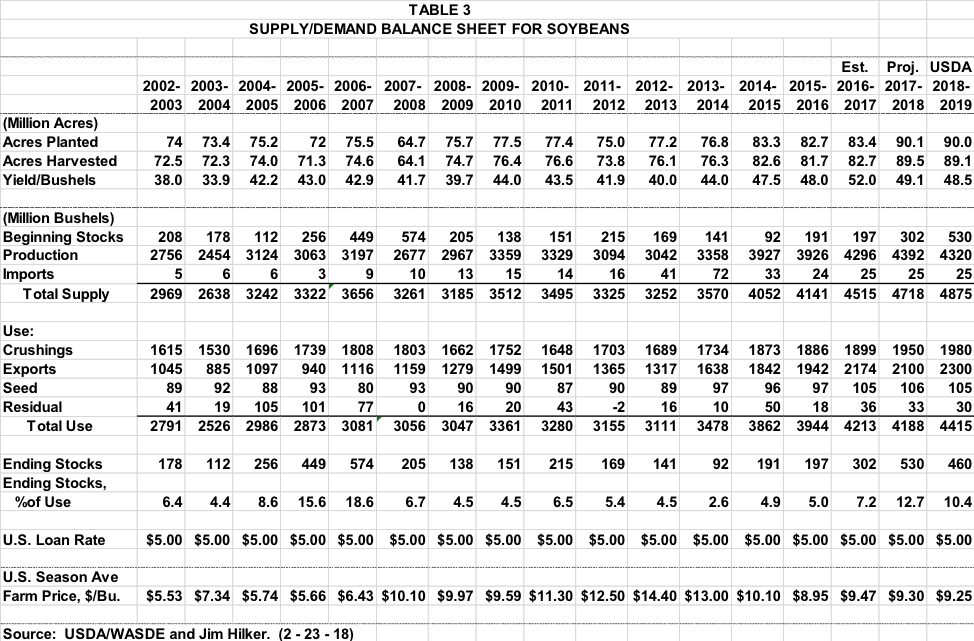
The USDA expects U.S. farmers to plant 90 million acres of soybeans, down slightly from last year’s 90.1 million. While the corn soybean ratio continues to favor soybeans, they feel the lower fertilizer prices will keep planted acres about the same for both corn and soybeans. Planted acres are forecast to be 89.1 million acres. They are using a weather adjusted trend yield of 48.5 bu/ac. This would put 2018 production at 4,230 million bushels, down 2% from 2017.
Total soybean supplies are expected to be a record 4,875 million bushels, up 3%. This is due to the higher beginning stocks that are expected to be up 227 million bushels, 75%. Imports are expected to be the same minuscule 25 million bushels that they have been in recent years.
The good news is, that expected 2018-19 use is expected to grow more than the big increase in supplies, the bad news is, it is not expected to help prices much in 2018-19 from 2017-18, but better than lower prices. Domestic use, made up of crush, seed and residual is projected to be up 1% to 2,115 million bushels. Crush is seen growing 30 million bushels to 1,980 million as crush margin are expected to improve on slightly lower soybean prices and steady soyoil and soymeal prices. Soymeal use is expected to gain 1.2% based on gains for pork and poultry. And soyoil use is expected to grow the same based on gains for edible and biodiesel consumption.
Soybean exports for 2018-19 are expected to be 2,300 million bushels, up 200 from projected 2017-18 marketing year exports. This is based on continued strong world demand, largely China, and smaller South American 2017-18 soybean crops.
Ending stocks under this scenario for 2018-19 would be 460 million bushels. While down 70 million bushels from 2017-18, it would still be the second largest ending stocks since 2006. The stocks to use ratio of 10.4% would indicate a soybean season average price of $9.25. Check out Table 3 for all the numbers.
Originally published in Michigan Farm Bureau's Michigan Farm News