Print
Print Email
EmailMarket Outlook - May 2018
 Corn
Corn
As of May 14, 62% of the U.S. corn crop was planted, near the five year average, but 6% behind last year. How much has been planted as you read this article. Updates on planting progress are made weekly, and reported Monday at 4 pm. Michigan was 34% planted, just below the five year average of 37%, but ahead of last year’s 27%. Emergence was for the U.S. corn crop was 28%, 1% lower than last year and 1% above the five year average.
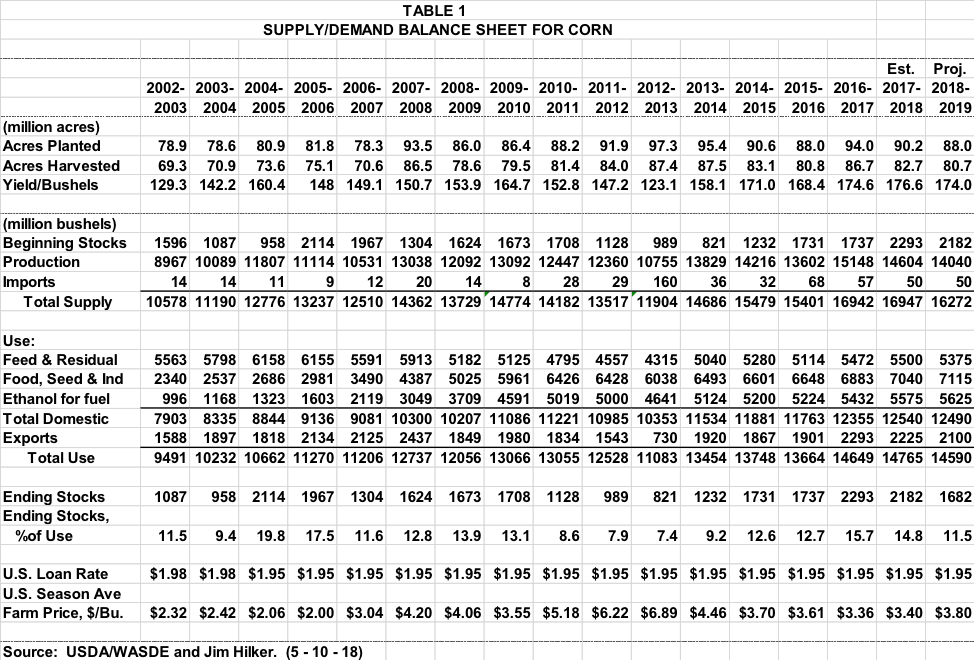
On May 10 the USDA/WASDE released their first supply/demand projections for the 2018-19 September 1 through August 31 corn marketing year. They were near expectations, both the trades, and mine. You can see the 2018-19 projections in Table 1. The USDA used 2018 planted acres from the March perspective Planting Report, 88 million, down 2.2 from 2017. The next update will be the USDA/NASS Acreage Report to be released June 29. Harvested acres were an historical average of the percent of planted acres. They used a yield of 174 bu/ac, a weather adjusted trend yield. The first objective yield survey will be in the August Crop Production Report.
This made projected production for 2018 just over 14 billion bushels, down just under 600 million from last year, with fewer acres and a lower yield. And with projected beginning stocks down 100 million bushels, total supply is projected to be down nearly 700 million bushels. But still the third largest on record after the past two years.
Total Corn use is expected to be down a modest 175 million bushels. Feed and residual use is expected to be down 125 million bushels, as a smaller crop, higher prices, and more ethanol by-products being fed offset a small expected increase in animal units. Corn used for ethanol is expected to be up 50 million bushels based on more gasoline consumption. Other commercial uses were expected to be up 25 million bushels. And 2018-19 corn exports are expected to be down 125 million bushels. The smaller Argentina and Brazil corn crops this past year will help our corn exports the first part of the new marketing year. But then large projected Ukraine and Russian corn crops are expected to provide the U.S. with a lot of combination for the remainder of the marketing year.
This will put 2018-19 projected ending stocks at 1682 million bushels, 11.5% of use, down from 14.8% of use this year. This puts the projected annual weighted average price at $3.80, about 10 cents less than the markets appears to be offering now.
Wheat
On May 10 USDA/NASS released the first objective winter wheat production survey for 2018. Winter wheat production is forecast at 1.19 billion bushels, down 6 percent from 2017. As of May 1, the United States yield is forecast at 48.1 bushels per acre, down 2.1 bushels from last year’s average yield of 50.2 bushels per acre.
Hard Red Winter production, at 647 million bushels, is down 14 percent from a year ago due to the drought in much of Kansas, Oklahoma, and Texas growing area. Soft Red Winter, at 315 million bushels, is up 8 percent from 2017. White Winter, at 229 million bushels, is up 1 percent from last year. Of the White Winter production, 21.2 million bushels are Hard White and 208 million bushels are Soft White.
Michigan is expected to harvest 490 million bushels, up 65 million from last year. With a yield based on a large farmer survey of 93 bushels per acre. If the 93 million bu/ac is realized, it would be a record yield, beating out the 2016 record wheat yield of 89 bu/ac. The 93 bu/acre is 10 bushels higher than the next highest wheat yield reported in any other state.
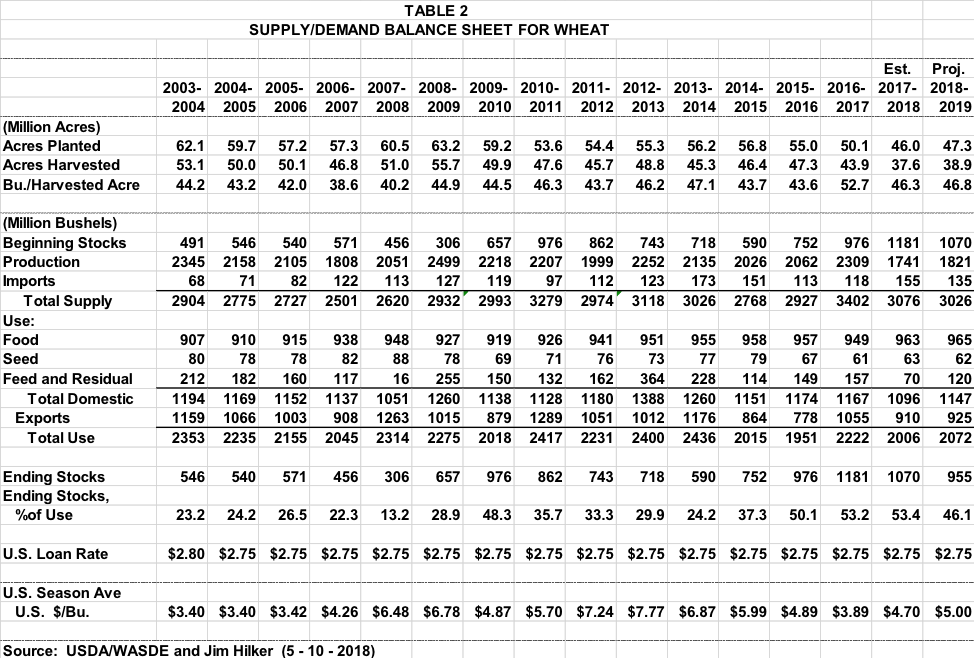
On May 10 the USDA/WASDE released their first supply/demand projections for the 2018-19 June 1 through May 31 wheat marketing year. Production was based on the winter wheat numbers just discussed, spring and durum planted wheat acres from the March Perspective Plantings Report and trend yield for spring and durum wheat. However, the May 14 Crop Progress Report showed spring wheat plantings were running behind both last year and the 5 year average.
The 2018-19 U.S. wheat crop is expected to be 1,821 million bushels, up 5% from this year. This is due to more harvested acres and a slightly higher yield. The spring wheat and durum wheat production is expected to be up 34% from last year’s lows, offsetting the lower hard red winter production. Beginning stocks are expected to be down 110 million bushels, offsetting the expected increase in production. This would put total supplies down 50 million bushels.
Total 2018-19 wheat use is expected to be up 66 million bushels to 2,072 million bushels. As food use is expected to be a record 965 million bushels, up 2 million bushels. Seed use is expected to be down 1 million bushels at 62 million. Feed use is expected to be up 50 million bushels from last year’s very low levels, but still lower than the five year average. This would put projected domestic use at 1,147 million bushels, up 51 million.
U.S. exports are expected to be up a marginal 15 million bushels in 2018-19, at 925 million bushels. World total wheat supplies are expected to be up a bit due to large beginning stocks. World wheat production is projected to be down due to a smaller Russian wheat crop. World consumption is expected to be record, meaning a decrease in world ending stocks for the 2018-19 wheat marketing year.
The 2018-19 U.S. Supply/Demand projections, shown in Table 2, would project ending stocks down 115 million bushels, a 4-year low. The USDA is projecting the average 2018-19 farm price midpoint 30 cents higher at $5.00/bu. While Michigan 2018 bids are lower than $5.00, when you account for the higher priced spring and durum wheat, it is close to what the market is offering.
Soybeans
As of May 13 soybean plantings were at 35%, 6% higher than last year at this time, and 9% higher than the 5-year average. Michigan’s 18% planted is up 8% from last year, and the same as the five year average. Parts of the Michigan took a lot of rain on the 11th and 12th, which may hold soybean plantings up. U.S. emergence was 10%, up marginally from last year and the 5-year average. What are the numbers as you read this article?
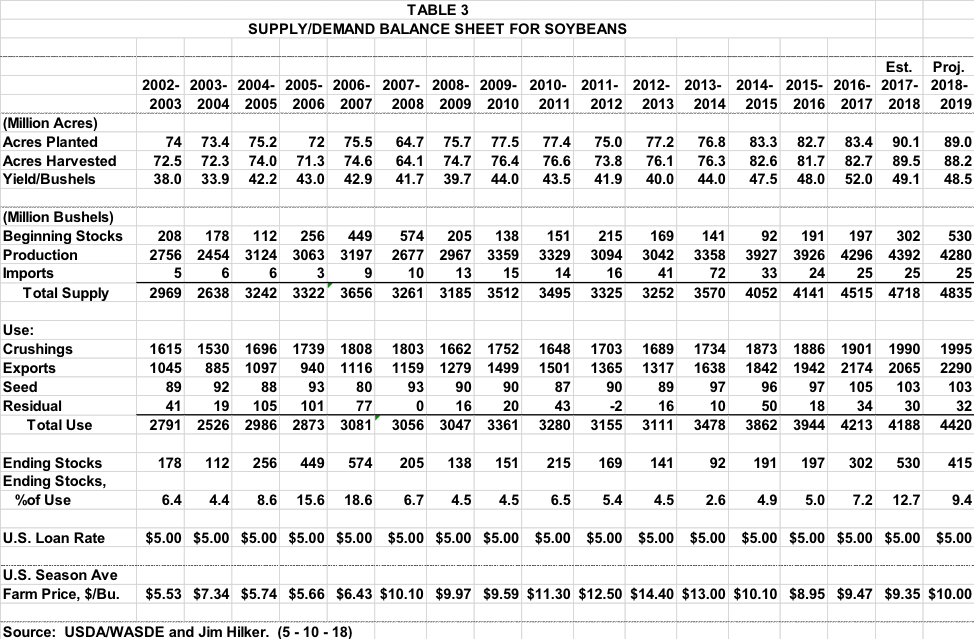
On May 10 the USDA/WASDE released their first supply/demand projections for the 2018-19 September 1 through August 31 soybean marketing year. The 2018-19 outlook for U.S. soybeans is for higher supplies, crush, exports, and lower ending stocks compared to 2017-18. The soybean crop is projected at 4,280 million bushels, down 112 million from last year’s record crop on lower harvested area and trend yields. With higher beginning stocks, soybean supplies are projected at 4,835 million bushels, up 2 percent from 2017-18.
The U.S. soybean crush for 2018-19 is projected at 1,995 million bushels, up slightly from the 2017-18 forecast with higher domestic soybean meal disappearance offset by lower projected soybean meal exports. U.S. soybean exports are forecast at 2,290 million bushels for 2018-19, up 225 million from 2017-18. U.S. soybean export share is projected at 39 percent, up from 2017-18 but otherwise the lowest since 2012-13. Reduced stocks in South America this fall will limit export competition during the first half of the 2018-19 marketing year.
U.S. ending stocks for 2018-19 are projected at 415 million bushels, down 115 million from the 2017-18 forecast. The 2018-19 U.S. season-average soybean price is forecast at $10.00/bu compared with $9.35/bu in 2017-18. All the numbers can be seen in Table 3. The $10.00 average price is higher than what the market is offering at this point.
Originally published in Michigan Farm Bureau's Michigan Farm News