Print
Print Email
EmailMarket Outlook - November 2018
 Corn
Corn
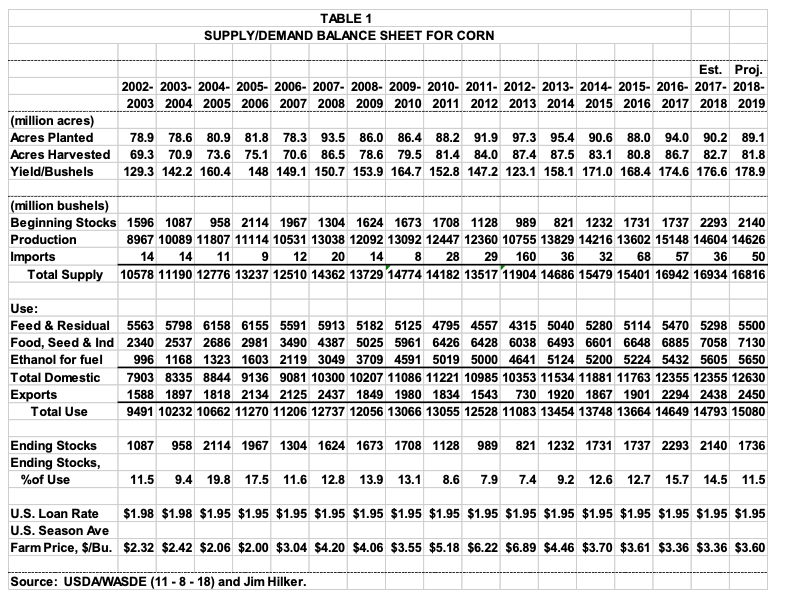
The November USDA/NASS Crop Production Report showed U.S. 2018 corn production to be 14.6 billion bushels. While this is down 1% from the October estimate, it would still be the second largest crop on record, just edging out 2017, and below the record produced in 2016 of 15.1 billion bushels. Based on November 1 conditions, 2018 yields are expected to average a record 178.9 bu/ac, down 1.8 from the October forecast, but 2.3 bushels higher than 2017, which had the second highest yield on record. The area harvested for grain is forecast at 81.8 million acres, down from the 92.7 million acres harvested in 2017. The U.S. has had its six largest corn crops the past six years.
The November 11 NASS Weekly Crop Progress Report showed 84% of the corn had been harvested. This is 3% higher than a year ago, and 3% below the 2013-17 average. There is some evidence that the quality of the remaining corn has dropped off since the data was collected for the November report. My guess is that the Final 2018 Crop Production Report will lower the corn production estimate a bit when released in January. But probably not enough to change the story, we have a lot of corn.
Michigan’s corn production forecast was 315.4 million bushels of corn, up 5.4 million from the October forecast. This come from 2.4 million planted acres, with 1.9 million harvested for grain acres, and a projected yield of 166 bu/ac. The 166 bushel average yield would be a record, beating out the 162 recorded in 2015. As of November 11, Michigan had harvested 67% of the corn acres, about the same as last year and the five year average. However, harvesting conditions were not good as I write November 14. I would be surprised if Michigan’s yield ends up at 166 bu/ac in the January report. The October report last year had Michigan at 168 bu/ac, and the January Final Report had Michigan at 159 bu/ac. Another change like this would not change the U.S. results significantly.
The updated November USDA World Agricultural Supply and Demand Estimates were also released November 11. U.S. total 2018-19 supply was lowered 152 million bushels due to the lower production estimate discussed above. Feed and residual use was lowered 50 million bushels based on the lower production and higher projected price. Projected exports were lowered 25 million bushels as projected 2018-19 world corn production was increased 30 million bushels. In net this lowered projected ending stocks from the October to November projections 77 million bushels to put it at 1,736 million bushels, 11.5% of use. Which puts 2018-19 ending stocks 404 million bushels below the 2017-18 marketing year, with its ending stocks to use of 14/5%. The USDA is projecting a 2018-19 average corn price with a midpoint of $3.60/bu, up $0.10 from last month, up $0.24 from 2017-18. All the numbers can be seen in Table 1 below.
I can’t see any fundamental or technical reason as of the date of this writing to project a price direction change from where we are. The prices we are seeing match up pretty well with the fundamentals discussion above. Both current prices and forward bids. The harvest basis relative to out months is strongly suggesting on farm storage will pay, but paying for commercial storage is a close call.
Wheat
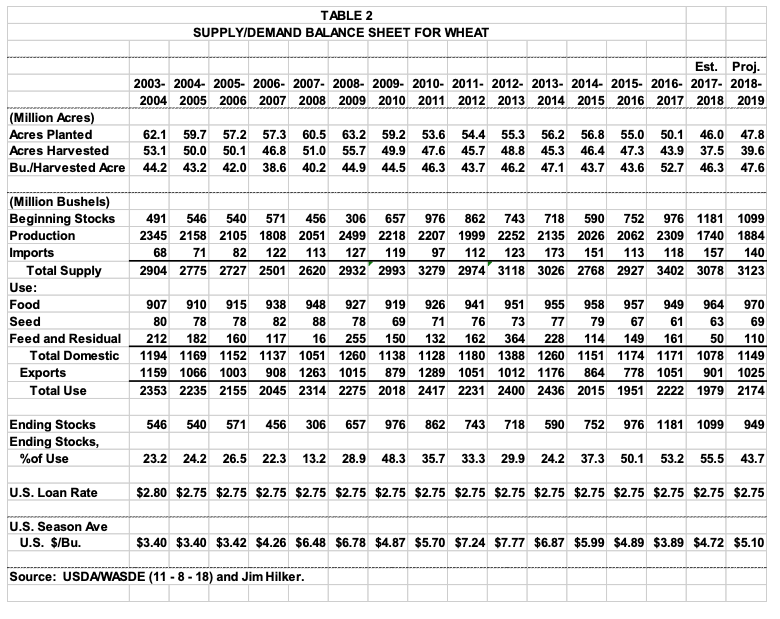
The 2018 U.S. wheat production projections were not updated in the November USDA Crop Production Report. The September Small Grains Summary released September 28 was the final projection until the January Final 2018 Crop Production Report is released. The U.S. projections can be seen in Table 2 below. There was basically only one change in the November USDA World Agricultural Supply and Demand Estimates versus October for wheat. Those numbers can also be seen in Table 2.
Wheat use in 2018-19 was increased 7 million bushels, as planted acres for 2019 is projected to increase. This lowers projected ending stocks a like amount. Find USDA’s 10-Year forecasts at: https://www.usda.gov/oce/commodity/projections/ . While things will change, there numbers provide a reasonable starting point for planning investments, etc.
The USDA Small Grain 2018 Summary showed Michigan planted wheat acres at 510,000 acres, up from 480,000 acres planted for 2017, but less than the 610,000 planted for 2016. The November 11 Crop Progress Report showed Michigan had planted 92% of the expected plantings, versus the five year average of 98% and last year’s 99%. This suggest that Michigan may not be a player in the increased wheat acreage projected for the U.S. as a whole next year.
Michigan’s 2018 harvested acres was put at 470,000 acres and the wheat yield was put at 76 bu/ac, down from both last year’s 79 bu/ac and the record yield of 89 bu/ac in 2016. Production was put at 35.7 million bushels compared to 33.6 million in 2017 and 50.7 million bushels in 2016.
Neither the basis nor forward wheat cash bids suggest storing wheat will pay. On farm or commercially.
Soybeans
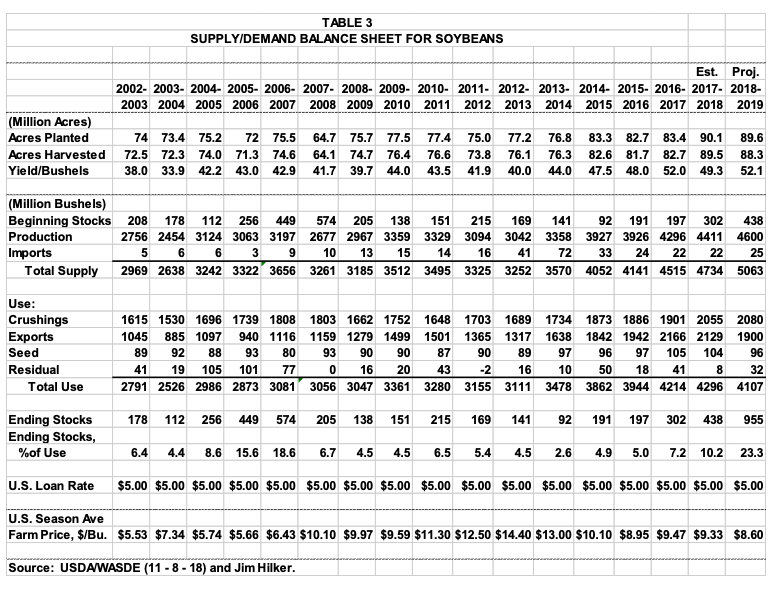
U.S. soybean production is forecast to be a record 4.6 billion bushels despite being down 2% from the October forecast. The previous record was last year at 4.4 billion bushels. And the top five years have been the past five years including 2018. The area harvested was lowered slightly from the October forecast to 88.3 million acers. The 2018 soybean yield was forecast in the November report to be 52.1 bu/ac, down 0.1 from October, but up 2.8 from last year. The yield was 52 bu/ac in 2016.
The November report showed Michigan is forecast to harvest 2.29 million acres of soybeans, 20,000 acres more than last year. The yield is projected to be 48 bu/ac, up 5.5 from last year, but 2.5 less than our 2016 record. These number would forecast production at 109.92 million bushels, up from 96.5 last year, and the previous record of 104.0 set in 2016.
As of November 11 88% of the U.S. soybean had been harvested, down from last year’s and the five year average of 93%. Michigan was at 79%, versus the five year average of 89%. Both the country and Michigan needs some much improved conditions to catch up and maintain the forecast yields and production.
The USDA made several significant changes to the 2018-19 Soybean/Demand projections in their November updates. One was the 90 million less forecast production discussed above. But more than offsetting the decrease in production was a 160 million bushel decrease in projected exports relative to previous forecasts due to fewer exports to China. Strong sales to other markets is expected to continue and will mean a higher percent of soybean exports will happen in the second half of the year relative to normal. However, the stronger expected sales to other markets are included in this forecast.
Ending stocks for 2018-19 are expected to be 955 million bushels, up 517 million from 2017-18. The stocks to use ratio is expected to be 23.8%, the highest since 1985. The USDA has put the midpoint of the average price forecast at $8.60. This is a bit higher than my interpretation of the fundaments are, and where today’s prices are, but soybean are storable, and I suspect the market believes soybean acres will be cut substantially next year. Along with a belief that the November weather may cut the average yield on the margin. All the U.S. numbers can be found in Table 3 below.
Soybean futures suggest the market is willing to pay 6-7 cents a month to store soybeans. And the forward contract bids suggest many the local elevators are willing to pay 5-7 cents per month for storage. These will more than pay for the opportunity costs of on farm storage, but come short of paying both elevator charges and the opportunity cost of storing commercially.